
The Iranian conflict: One month later
At the eleventh hour, the US and Iran have agreed to a temporary ceasefire, with escalating attacks to be held off for two weeks. The equity market has so far soared on the announcement, with Brent crude futures free falling.
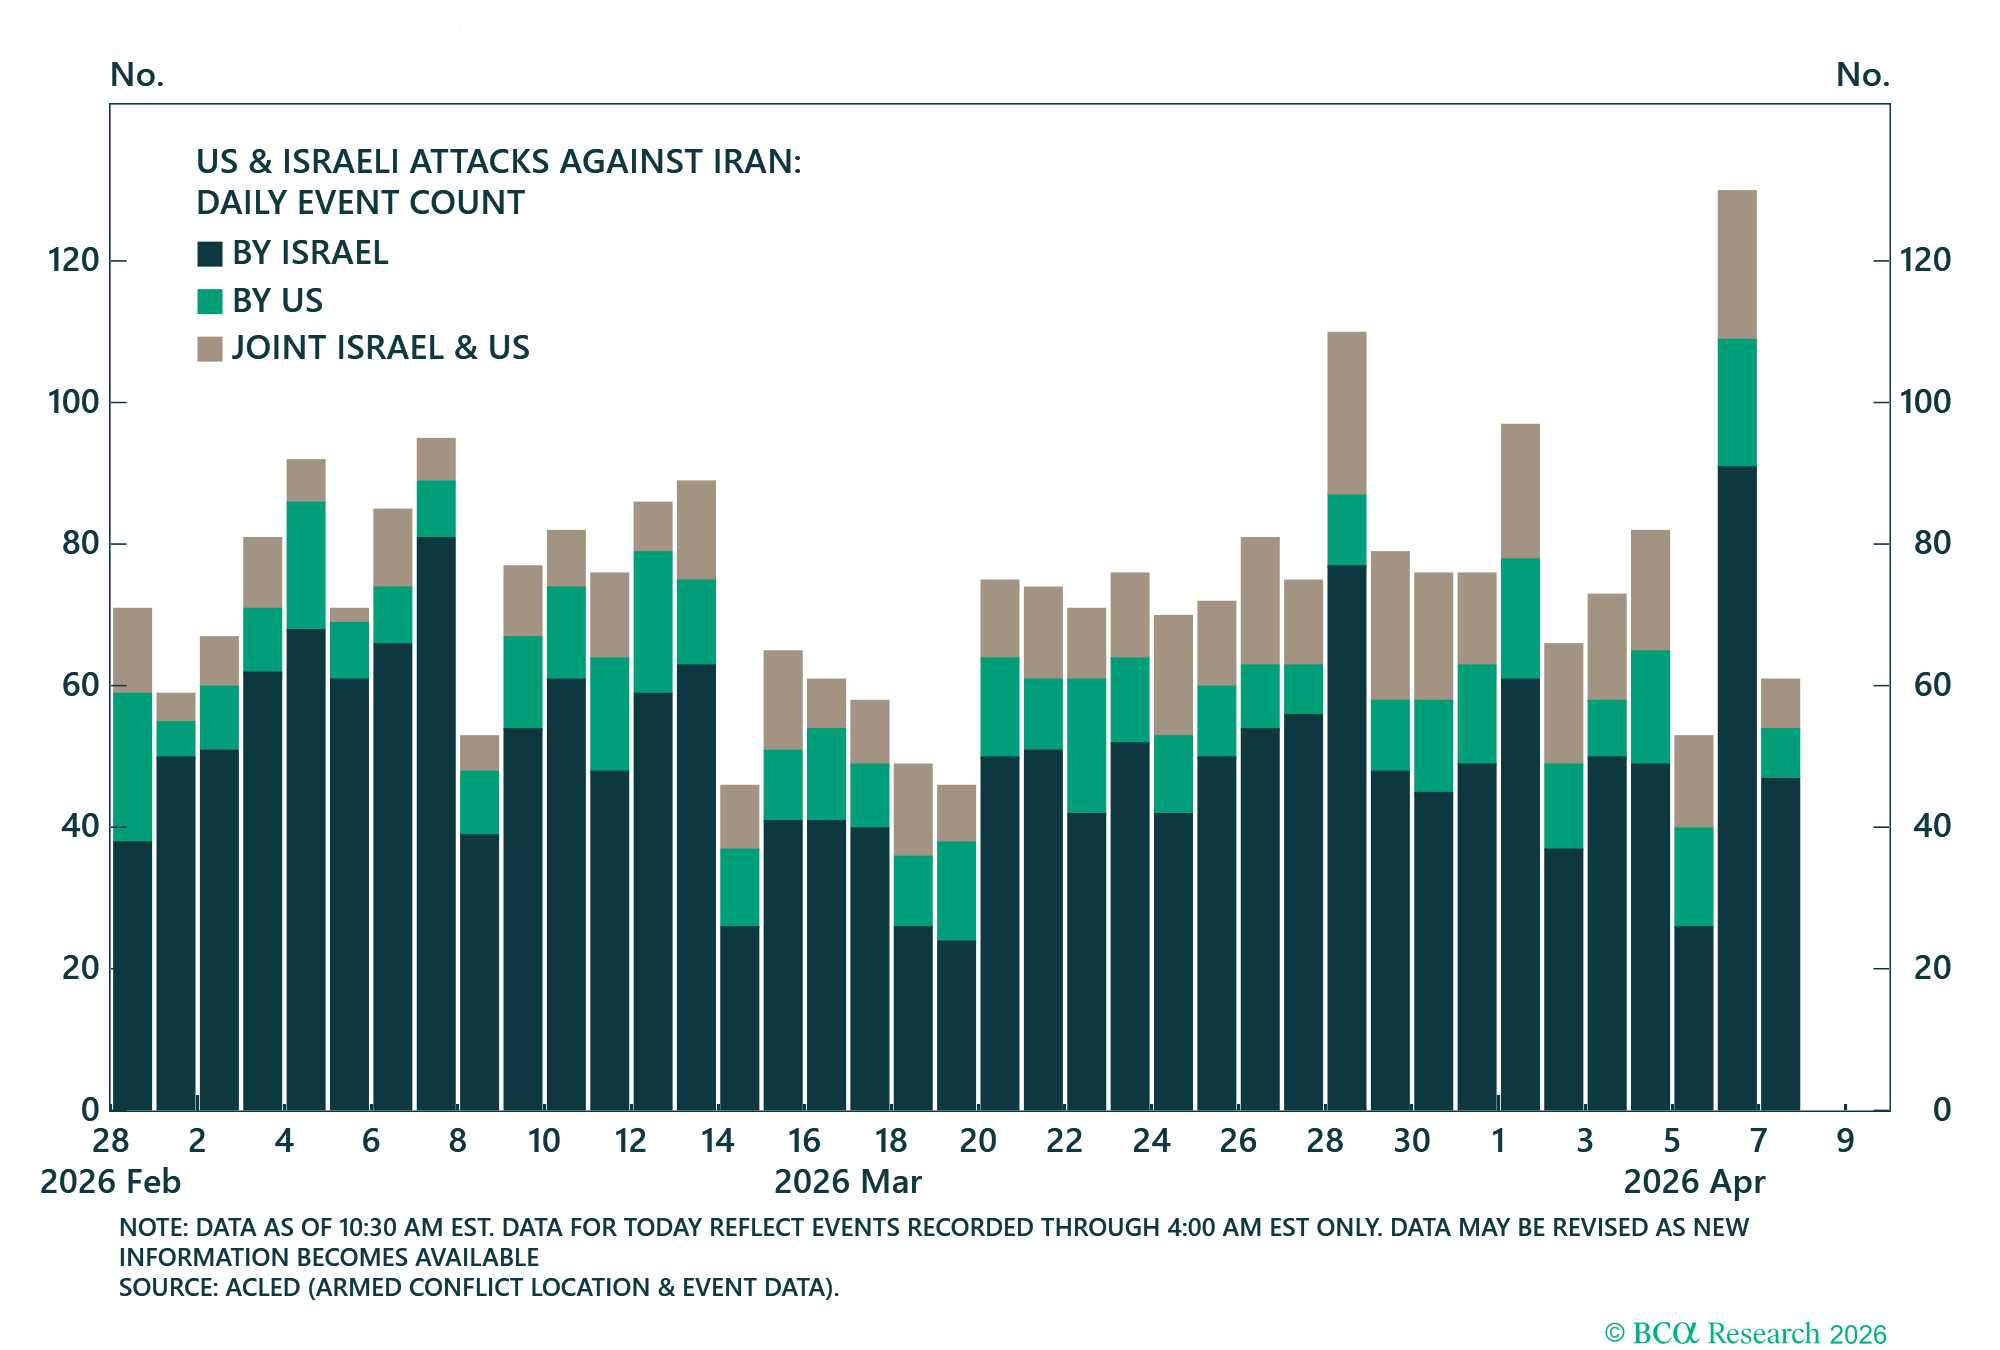
Figure 1 – US & Israel strikes had been consistently high throughout March
Over the last month, an average of 60 to 80 independent strike events were carried out on a daily basis against Iran, by the US and Israel – see Figure 1. On the weekend just prior to the ceasefire announcement, the number of strike events jumped to 120+.

Figure 2 – Iran’s attacks on its Gulf neighbours dwindled down by the end of March
On the other side, Iran began March with around 20 to 40 daily strikes levied against their neighbours (both Israel and various Gulf states). This range “subdued” to mostly less than 15 per day by the close of March – see Figure 2. Notably, the bulk of the decline pertains to the strikes levied against the Gulf states, the region with the greatest economic significance.
The narrative has swung back and forth on the war’s outlook, even before President Trump’s ceasefire announcement. It is too early to tell whether this ceasefire will amount to a permanent calming of the geopolitical tension in the Middle East.
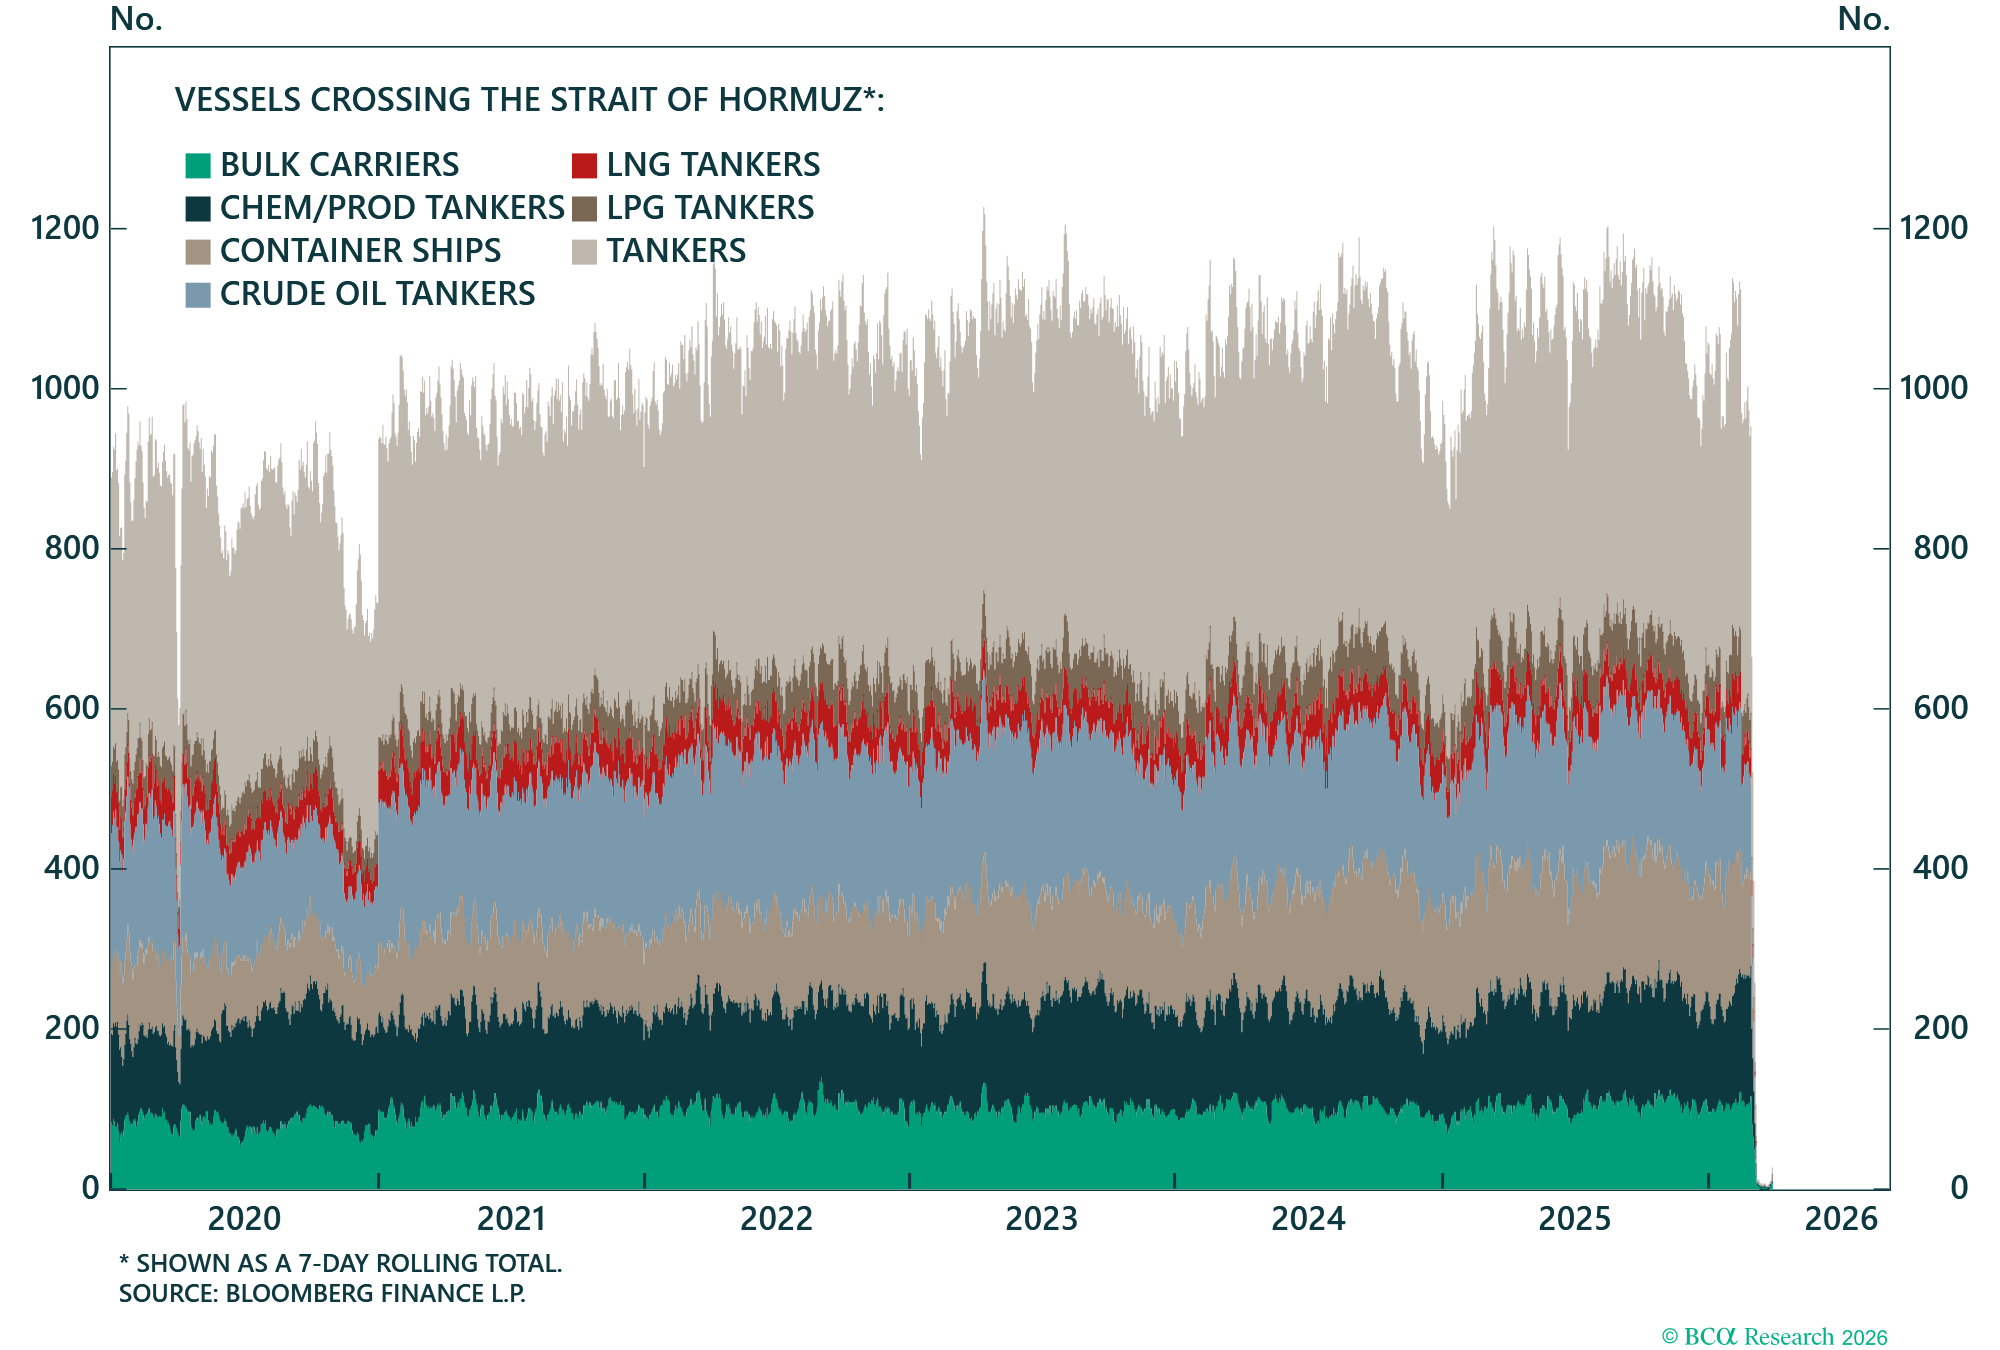
Figure 3 – Overnight, 1,100 ships passing through the Strait of Hormuz dropped to near zero when the war broke out
From an economic standpoint, the Strait of Hormuz remains the most vital piece of this story. Data shows that transit in Hormuz picked up over the course of March, with a bit more than 25 ships crossing the Strait by the prior month end. This has increased to 30+ ships over the first few days of April. Regardless, traffic remains far below the 2025 average of about 1,100 ships – see Figure 3. A likely condition to maintain the ceasefire, and for the Strait to be opened up in whole, is for Iran to be granted a toll fee per barrel that passes along the channel.
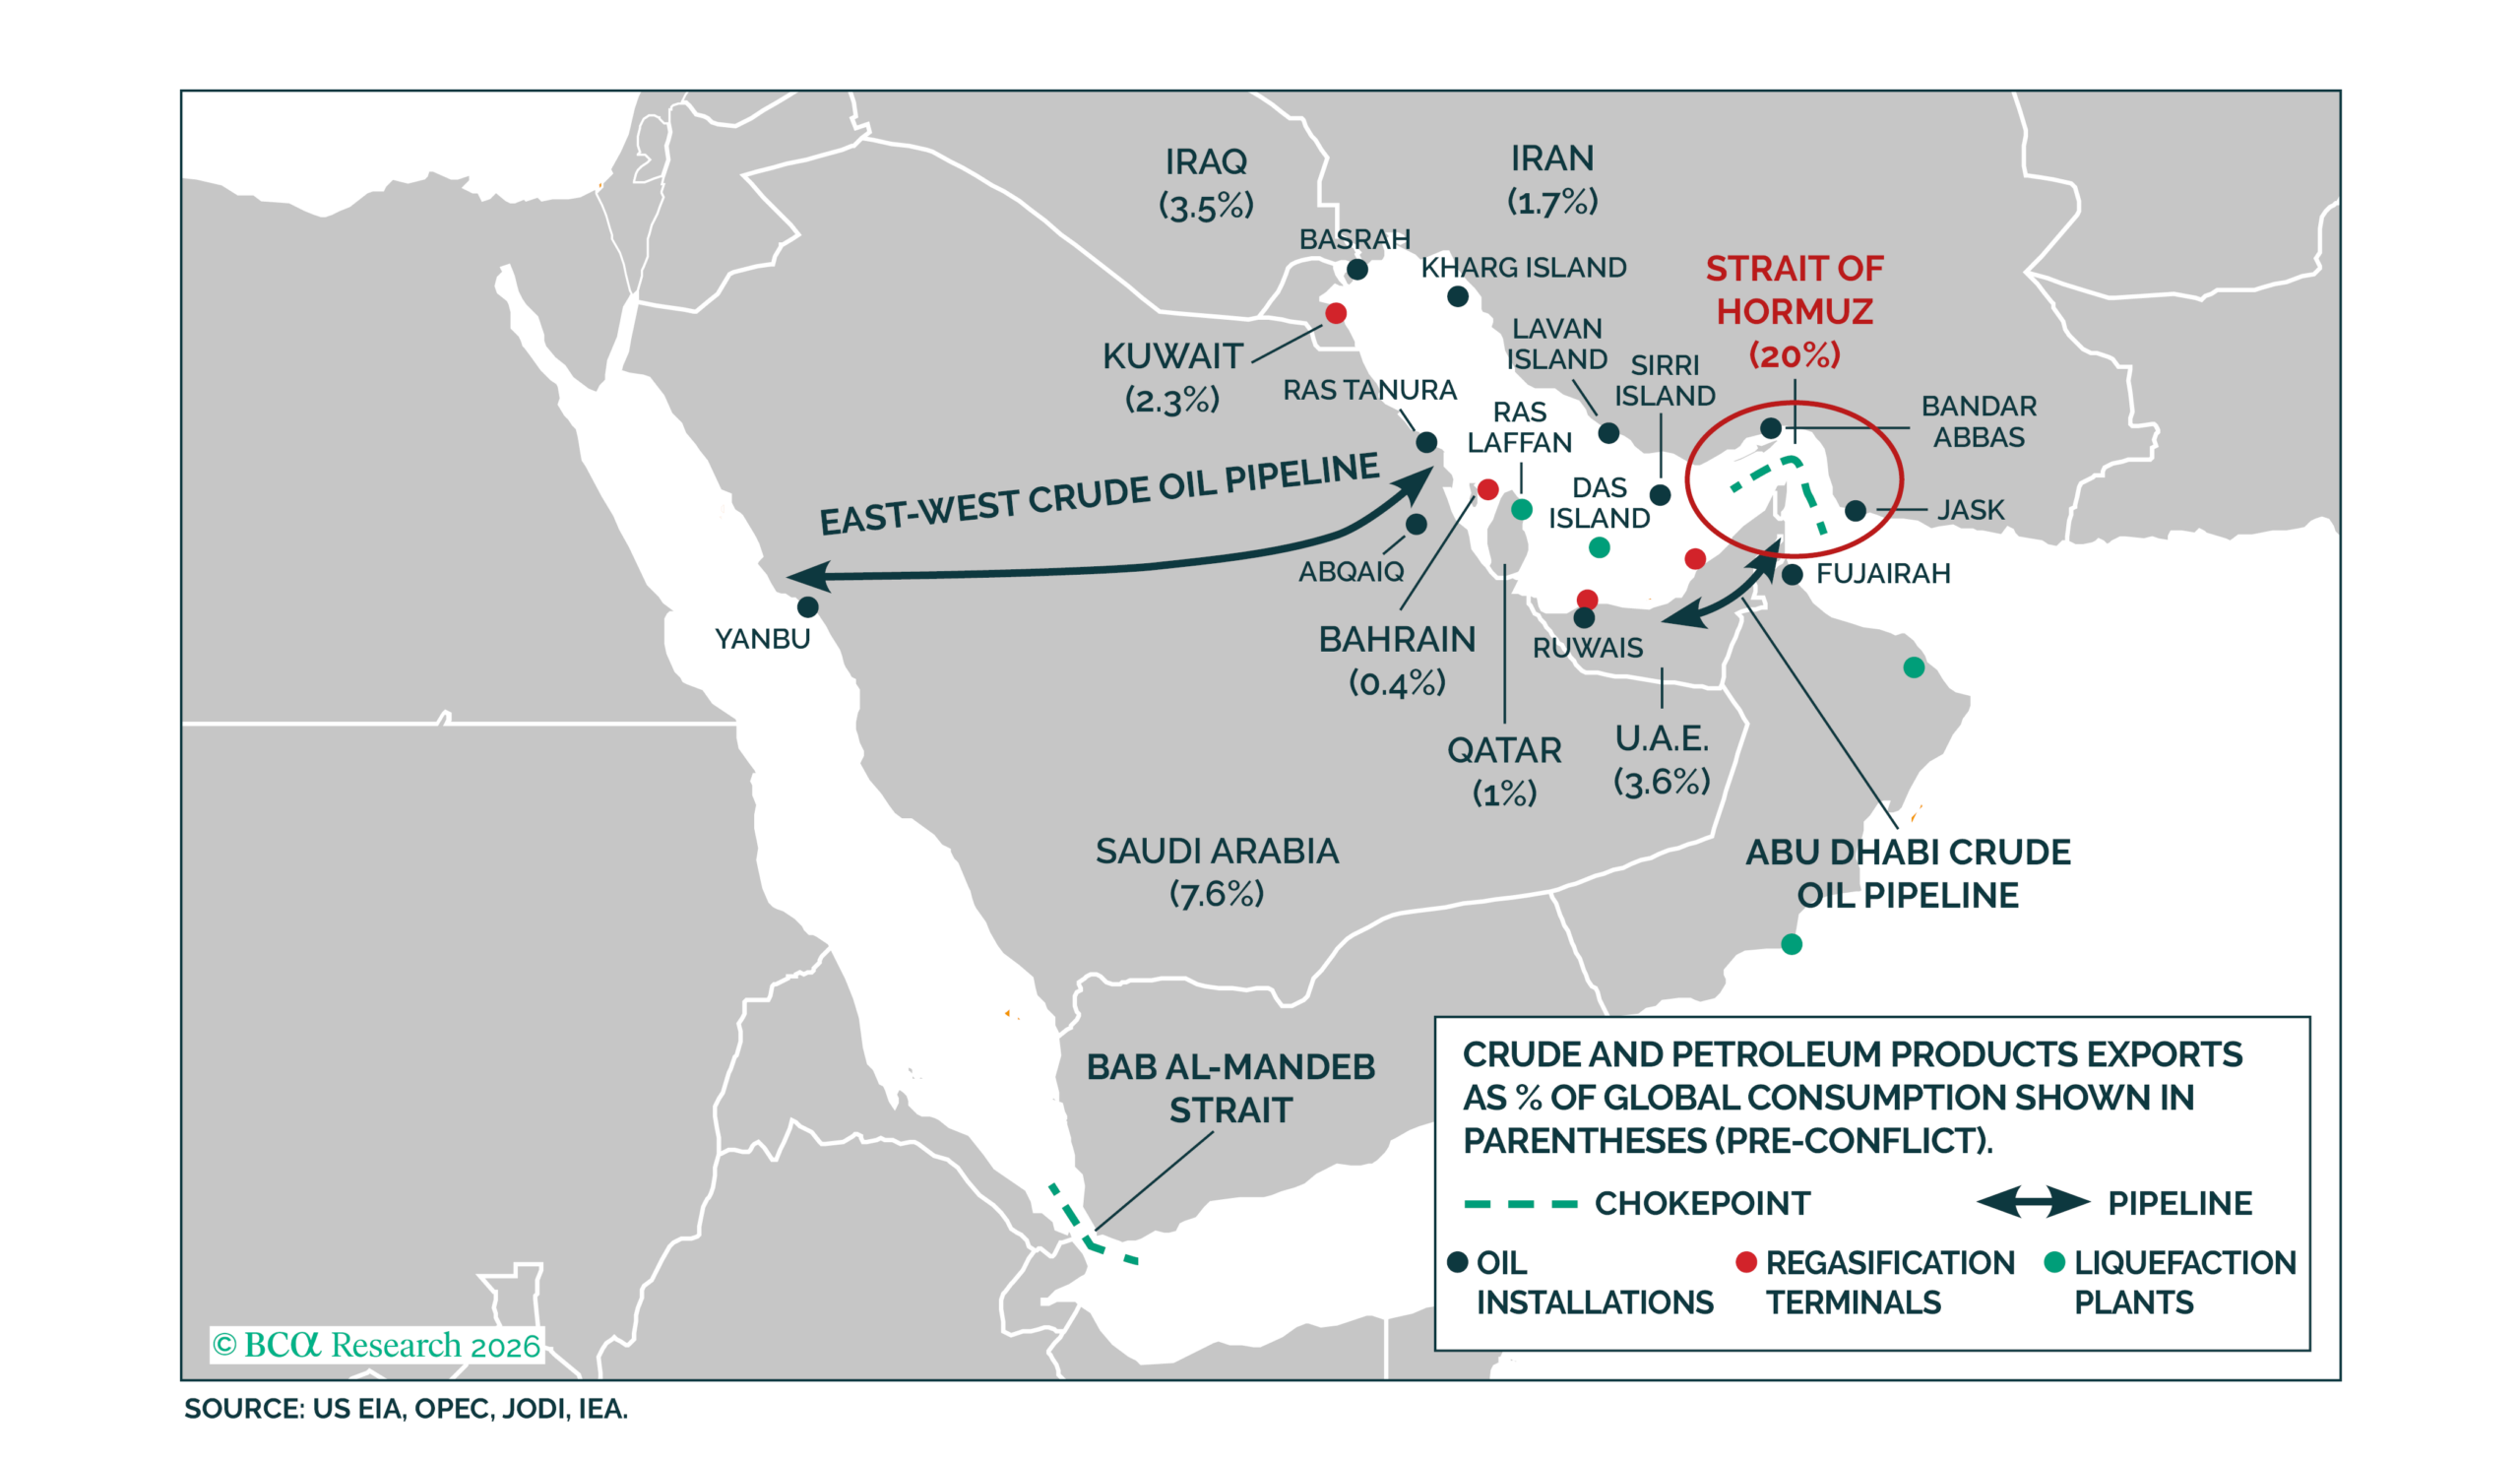
Figure 4 – 20% of the world’s petroleum passes through the Strait
While strategies have been proposed to circumvent the strait, such as the East-West crude oil pipeline along Saudi Arabia, it is unquestionable that the benefit of reopening transit via the Hormuz Strait will be second to none – see Figure 4. The prevailing issue is that the condition of a Hormuz toll would not be a sustainable position for the US. Thus, medium-term risks regarding the tensions should still remain front of mind until further clarity is established.
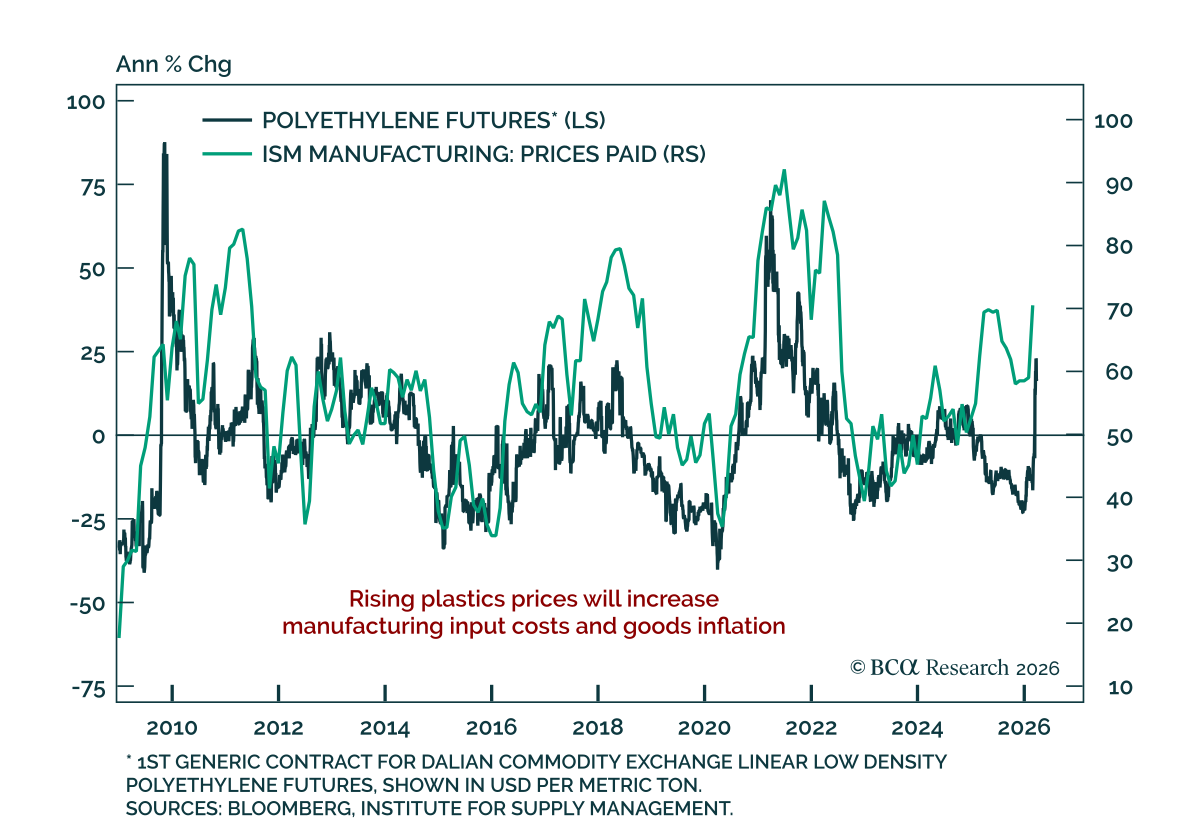
Figure 5 – A repeat in oil spikes will incur several second-order inflationary effects
As it stands, the recent reversal in the oil market may not be truly reflective of the global economy’s risk profile, given the ceasefire agreement. Beyond just the risk that the agreement falls through, the war has seen significant damage to both oil and natural gas infrastructure. Furthermore, the logistics of a rapid reopening of the Strait will still mean a near-term supply deficit in energy inputs. Thus, a best-case scenario still exhibits some inflationary fears.
Inflation shocks would not just stop at crude’s first-order impact, as various second-order effects can bleed into core inflation through channels such as packaging. This complicates how central banks may be forced to deal with this, especially if futures for these inputs jump back to their March highs – see Figure 5.
The US story
1. The economy:
March US consumer confidence surprised slightly to the upside, but the labour market remains weak, and uncertainty will weigh on growth at the margin. The Conference Board Consumer Confidence Index ticked up to 91.8 from 91.2.
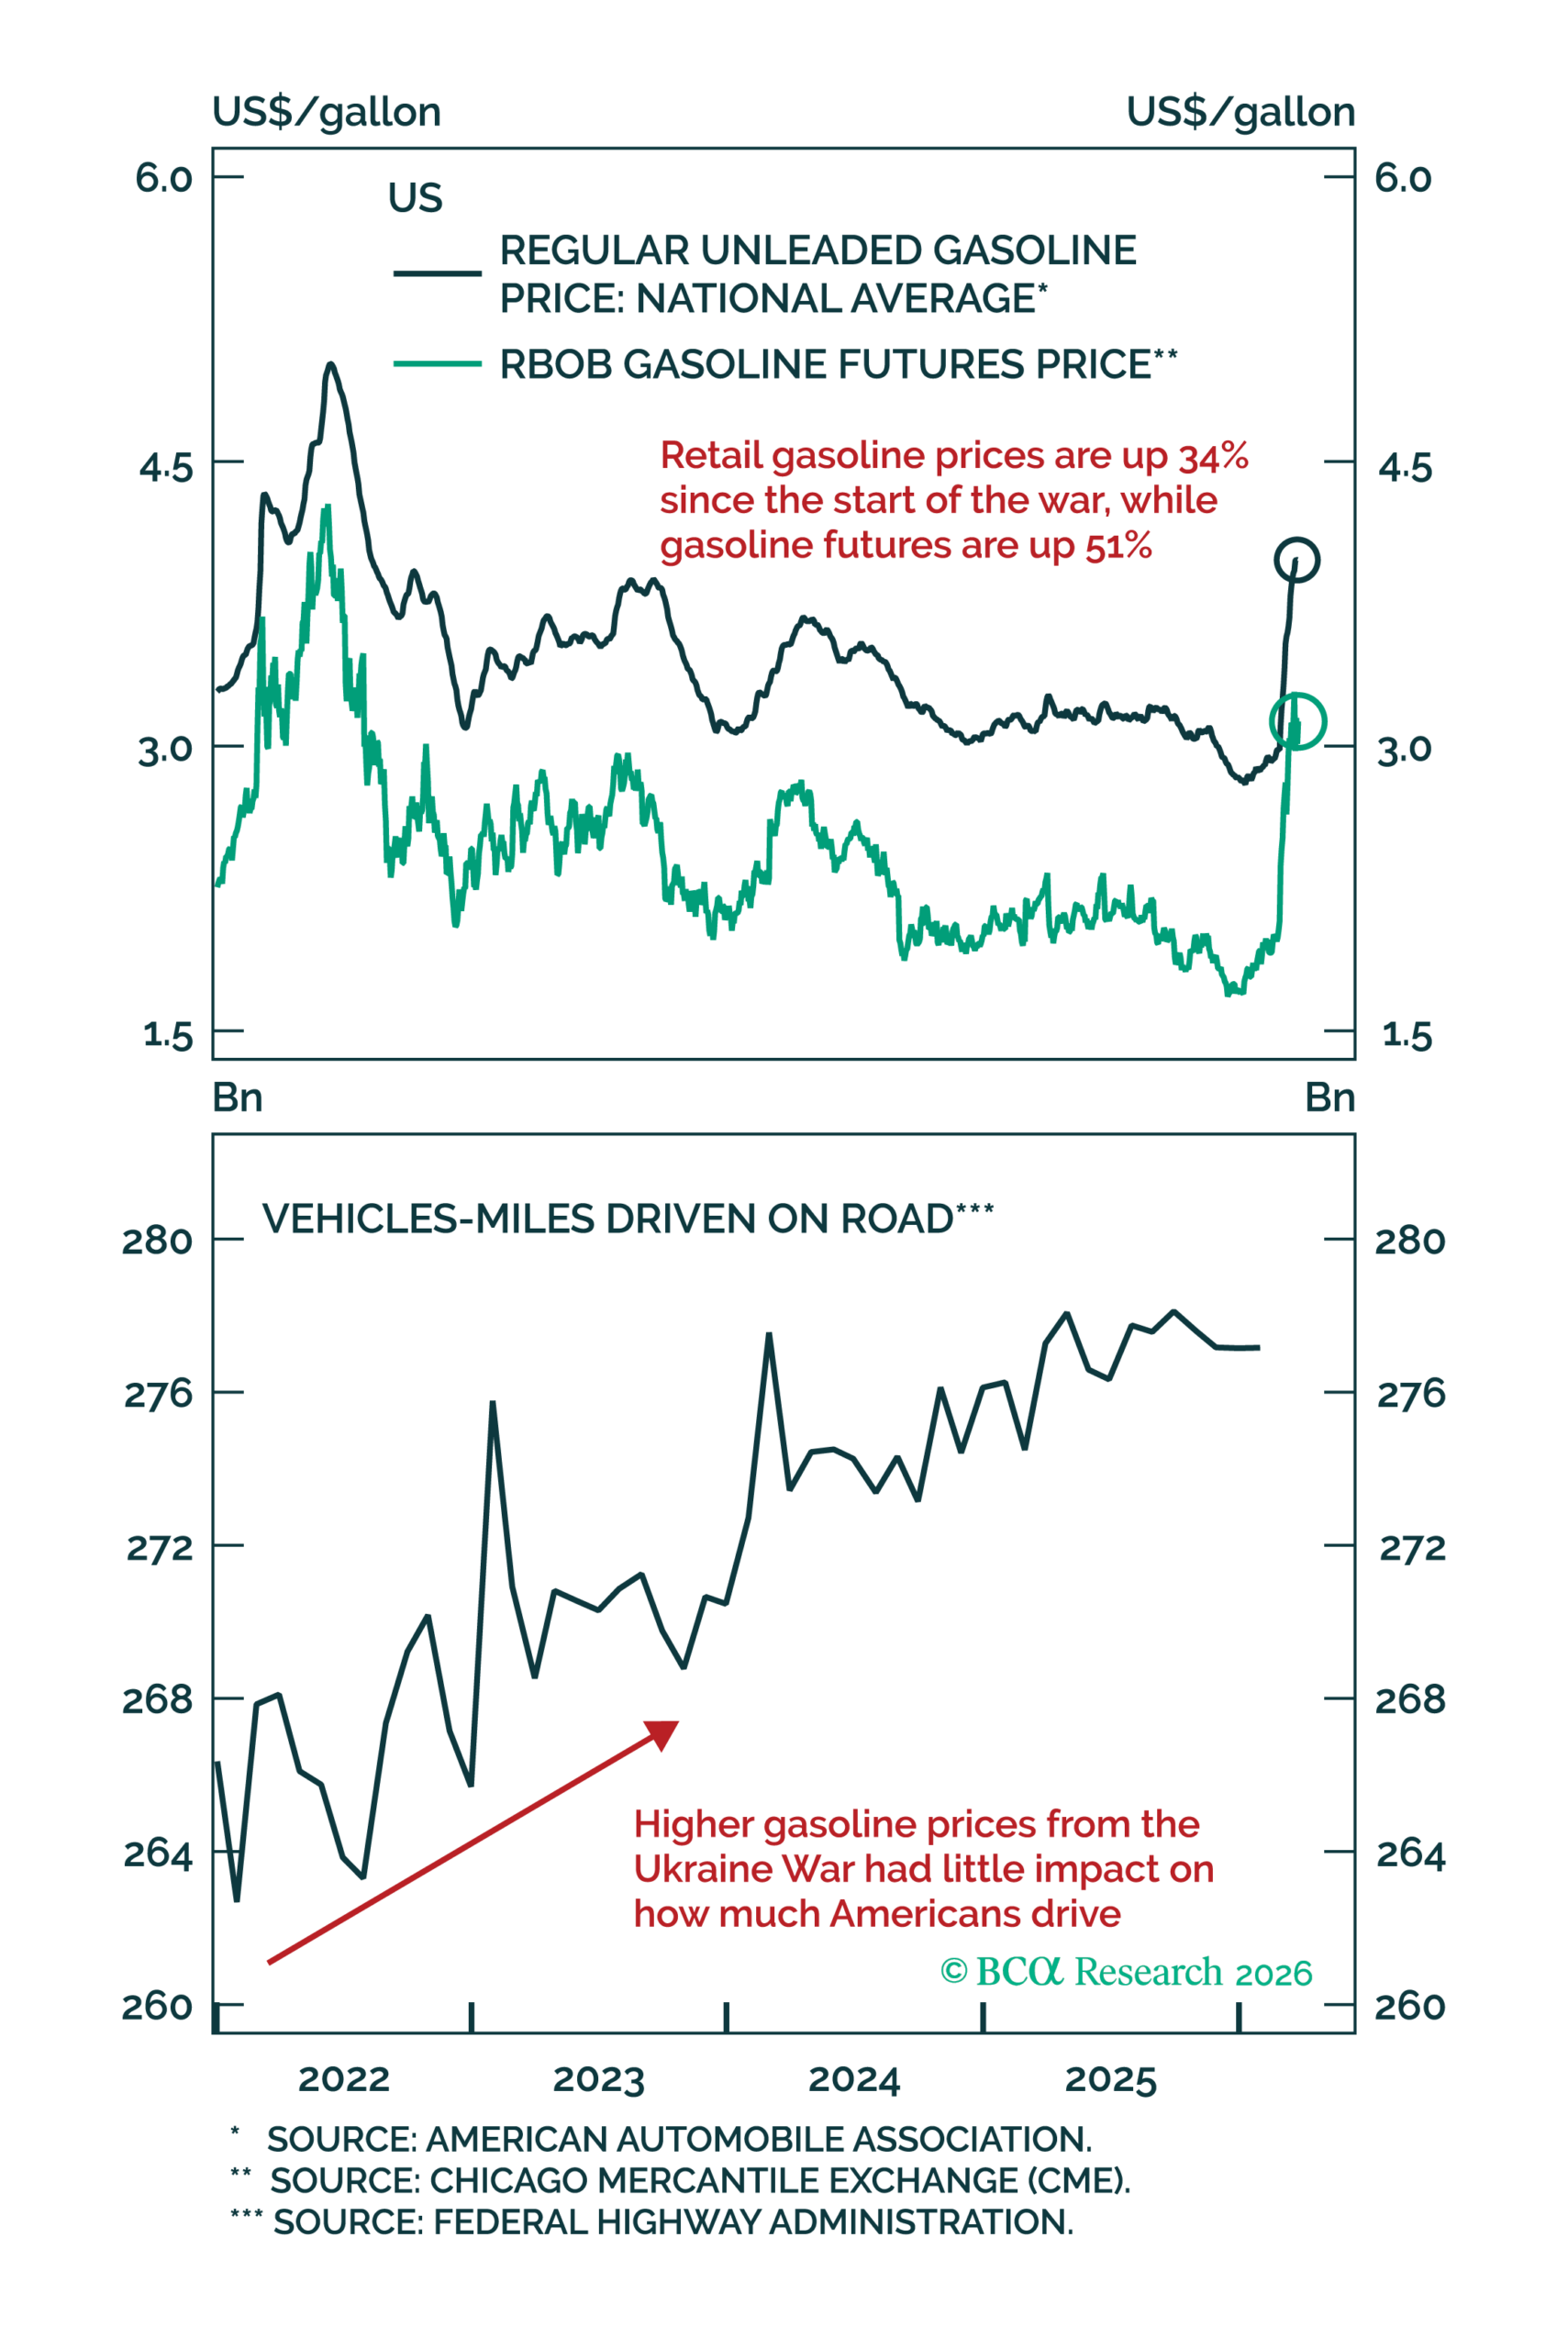
Figure 6 – As petrol prices increase, Americans are driving more than ever
While US shale had kept the American economy mostly insulated from the oil shocks experienced by the rest of the global market, elevated gasoline prices remain as a material headwind on consumption and activity in the near term – see Figure 6, top panel. The spike in gasoline comes against the backdrop of Americans driving increasingly more every year – see Figure 6, bottom panel. A weak labour market may actually be a boon for the US at this time, as it will offset any second-order inflationary effects in the event of a prolonged inflationary shock.
2. The equity market (and the AI trade today):
We have seen the market begin penalising the multiples of AI hyperscalers as they shift from their prior asset-light business models to infrastructure heavy. There has been a growing pushback against the buildout, with a net majority of respondents to the BofA Fund Manager Survey saying that US companies are investing too much.
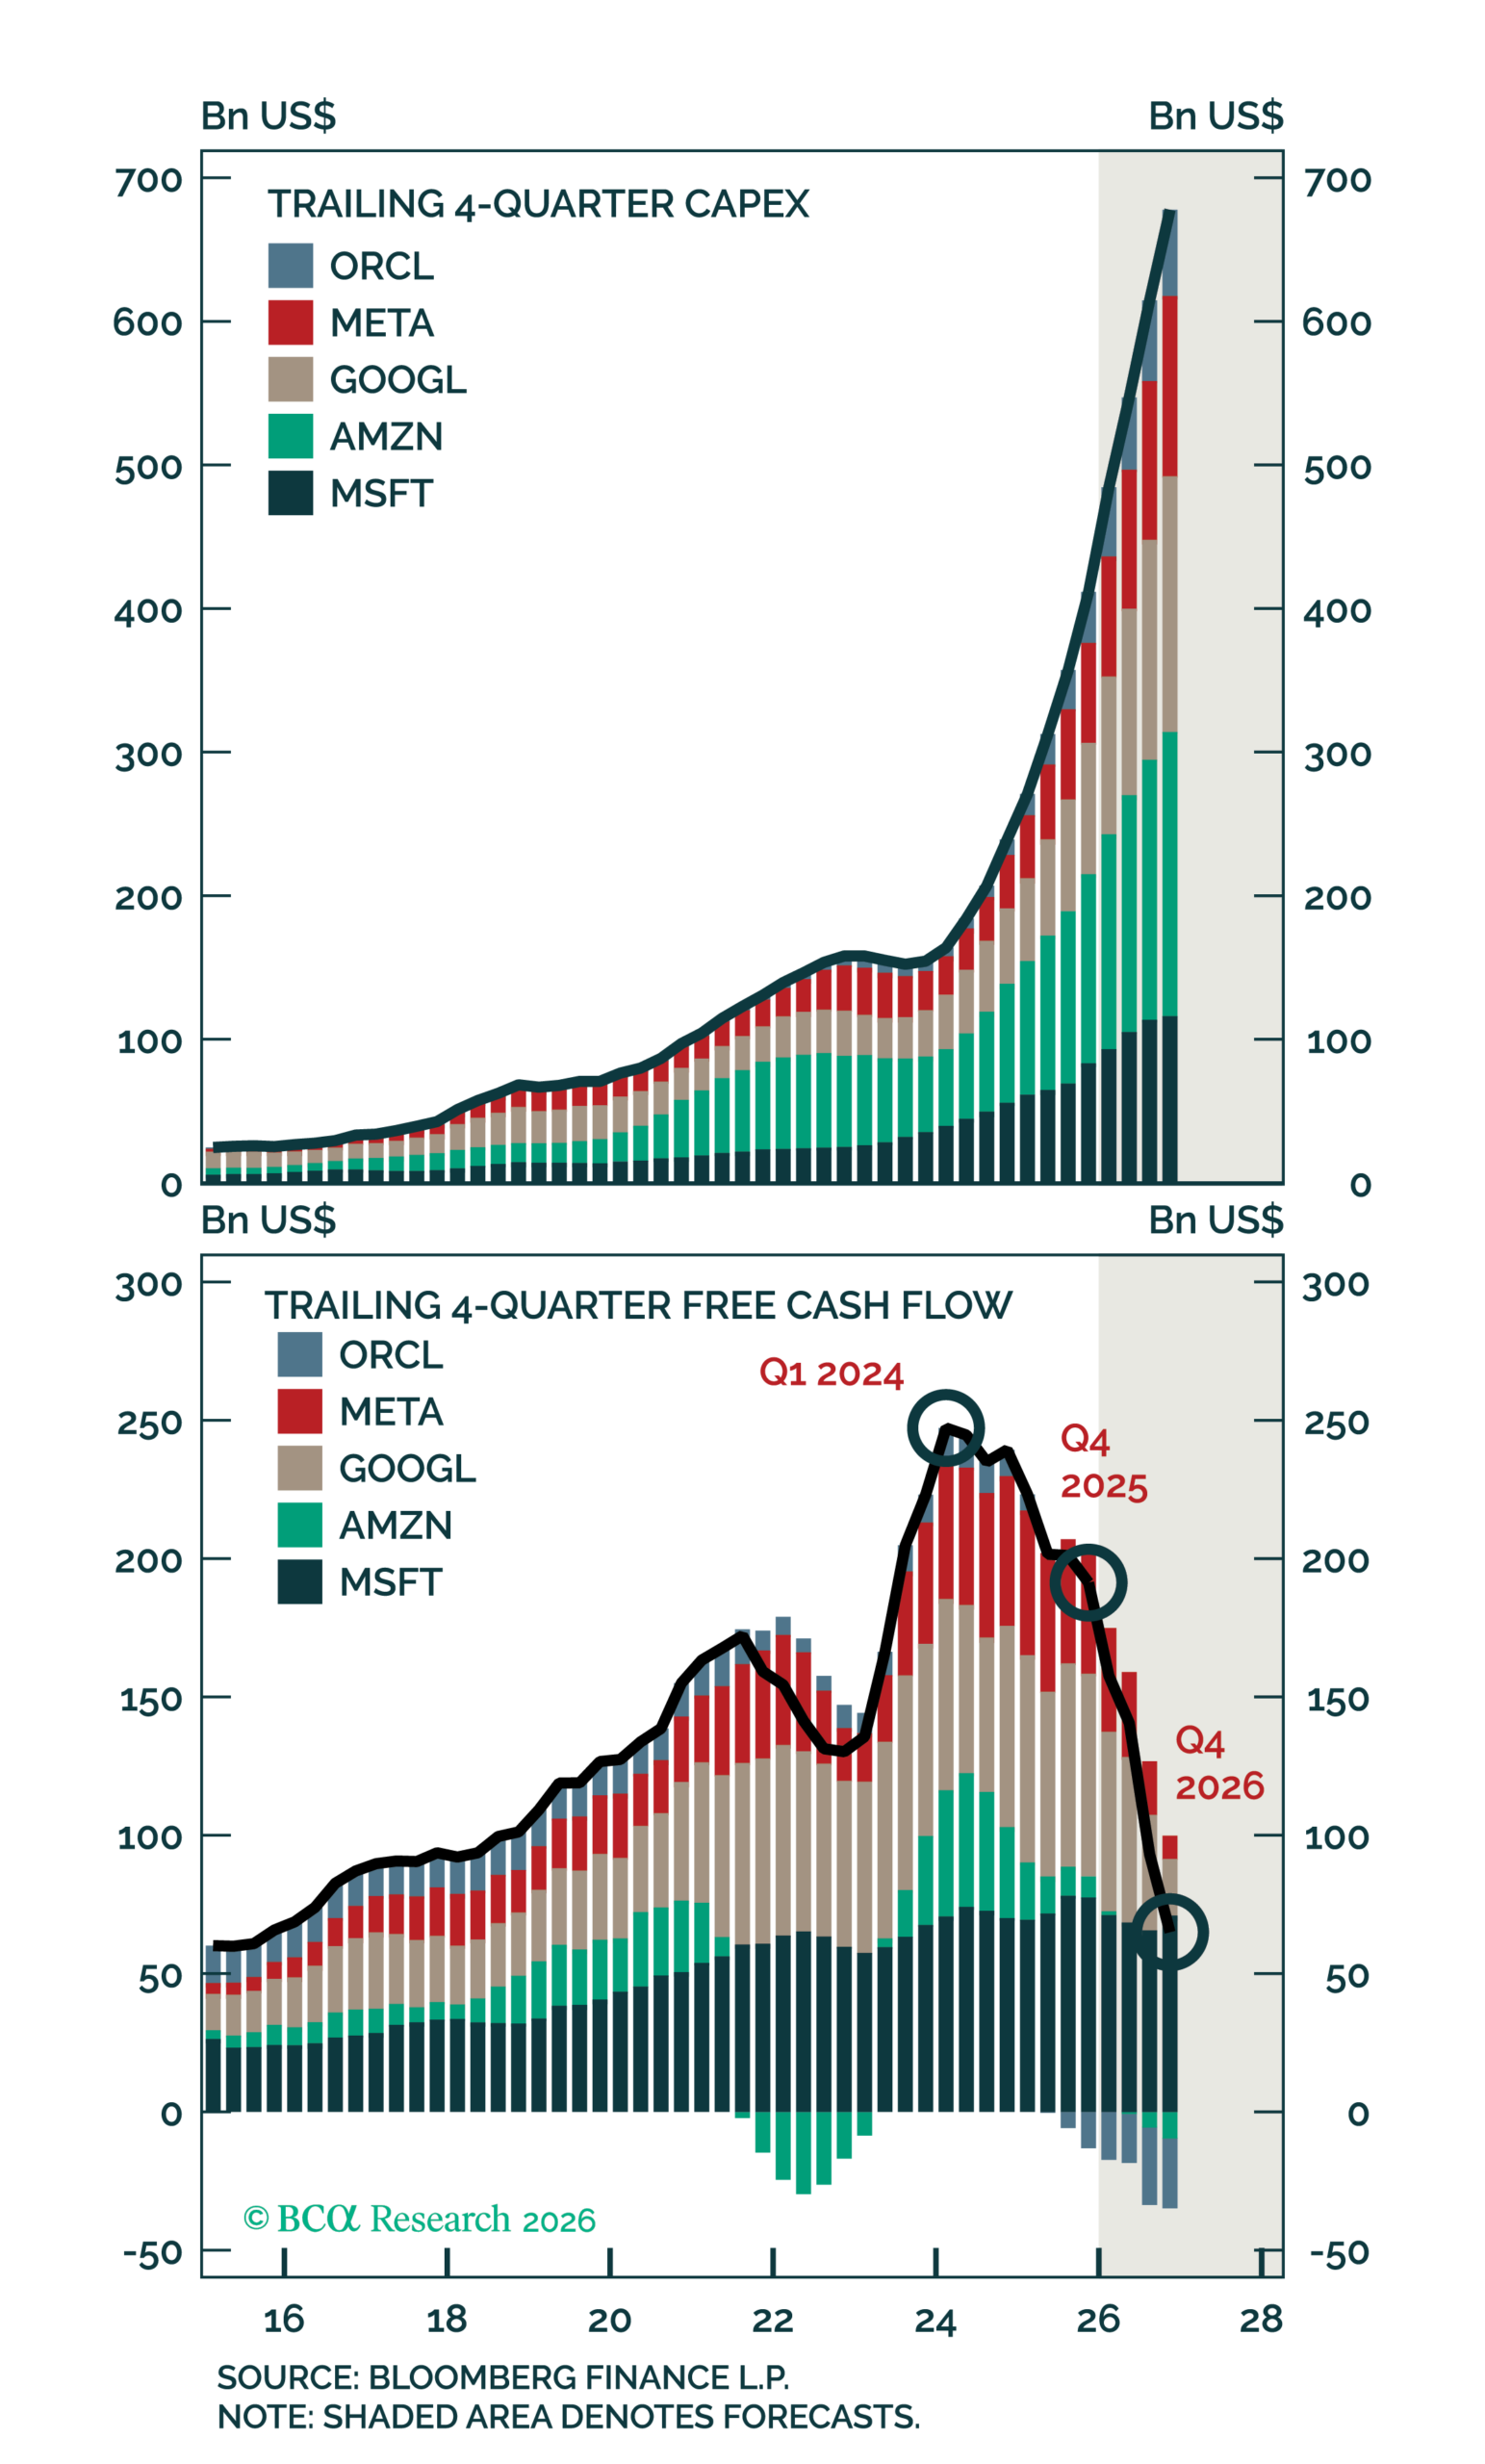
Figure 7 – The AI buildout is pressuring current free cash flow margins
Lower spending on AI hardware would be bad news for companies such as Nvidia. In contrast, it might be good news for the hyperscalers, whose capex bills will go down across the board (without worry of falling behind competition). So far, hyperscaler free cash flows have suffered, as we remain in the early stages of the buildout, without the full monetisation benefit being available yet for many – see Figure 7.
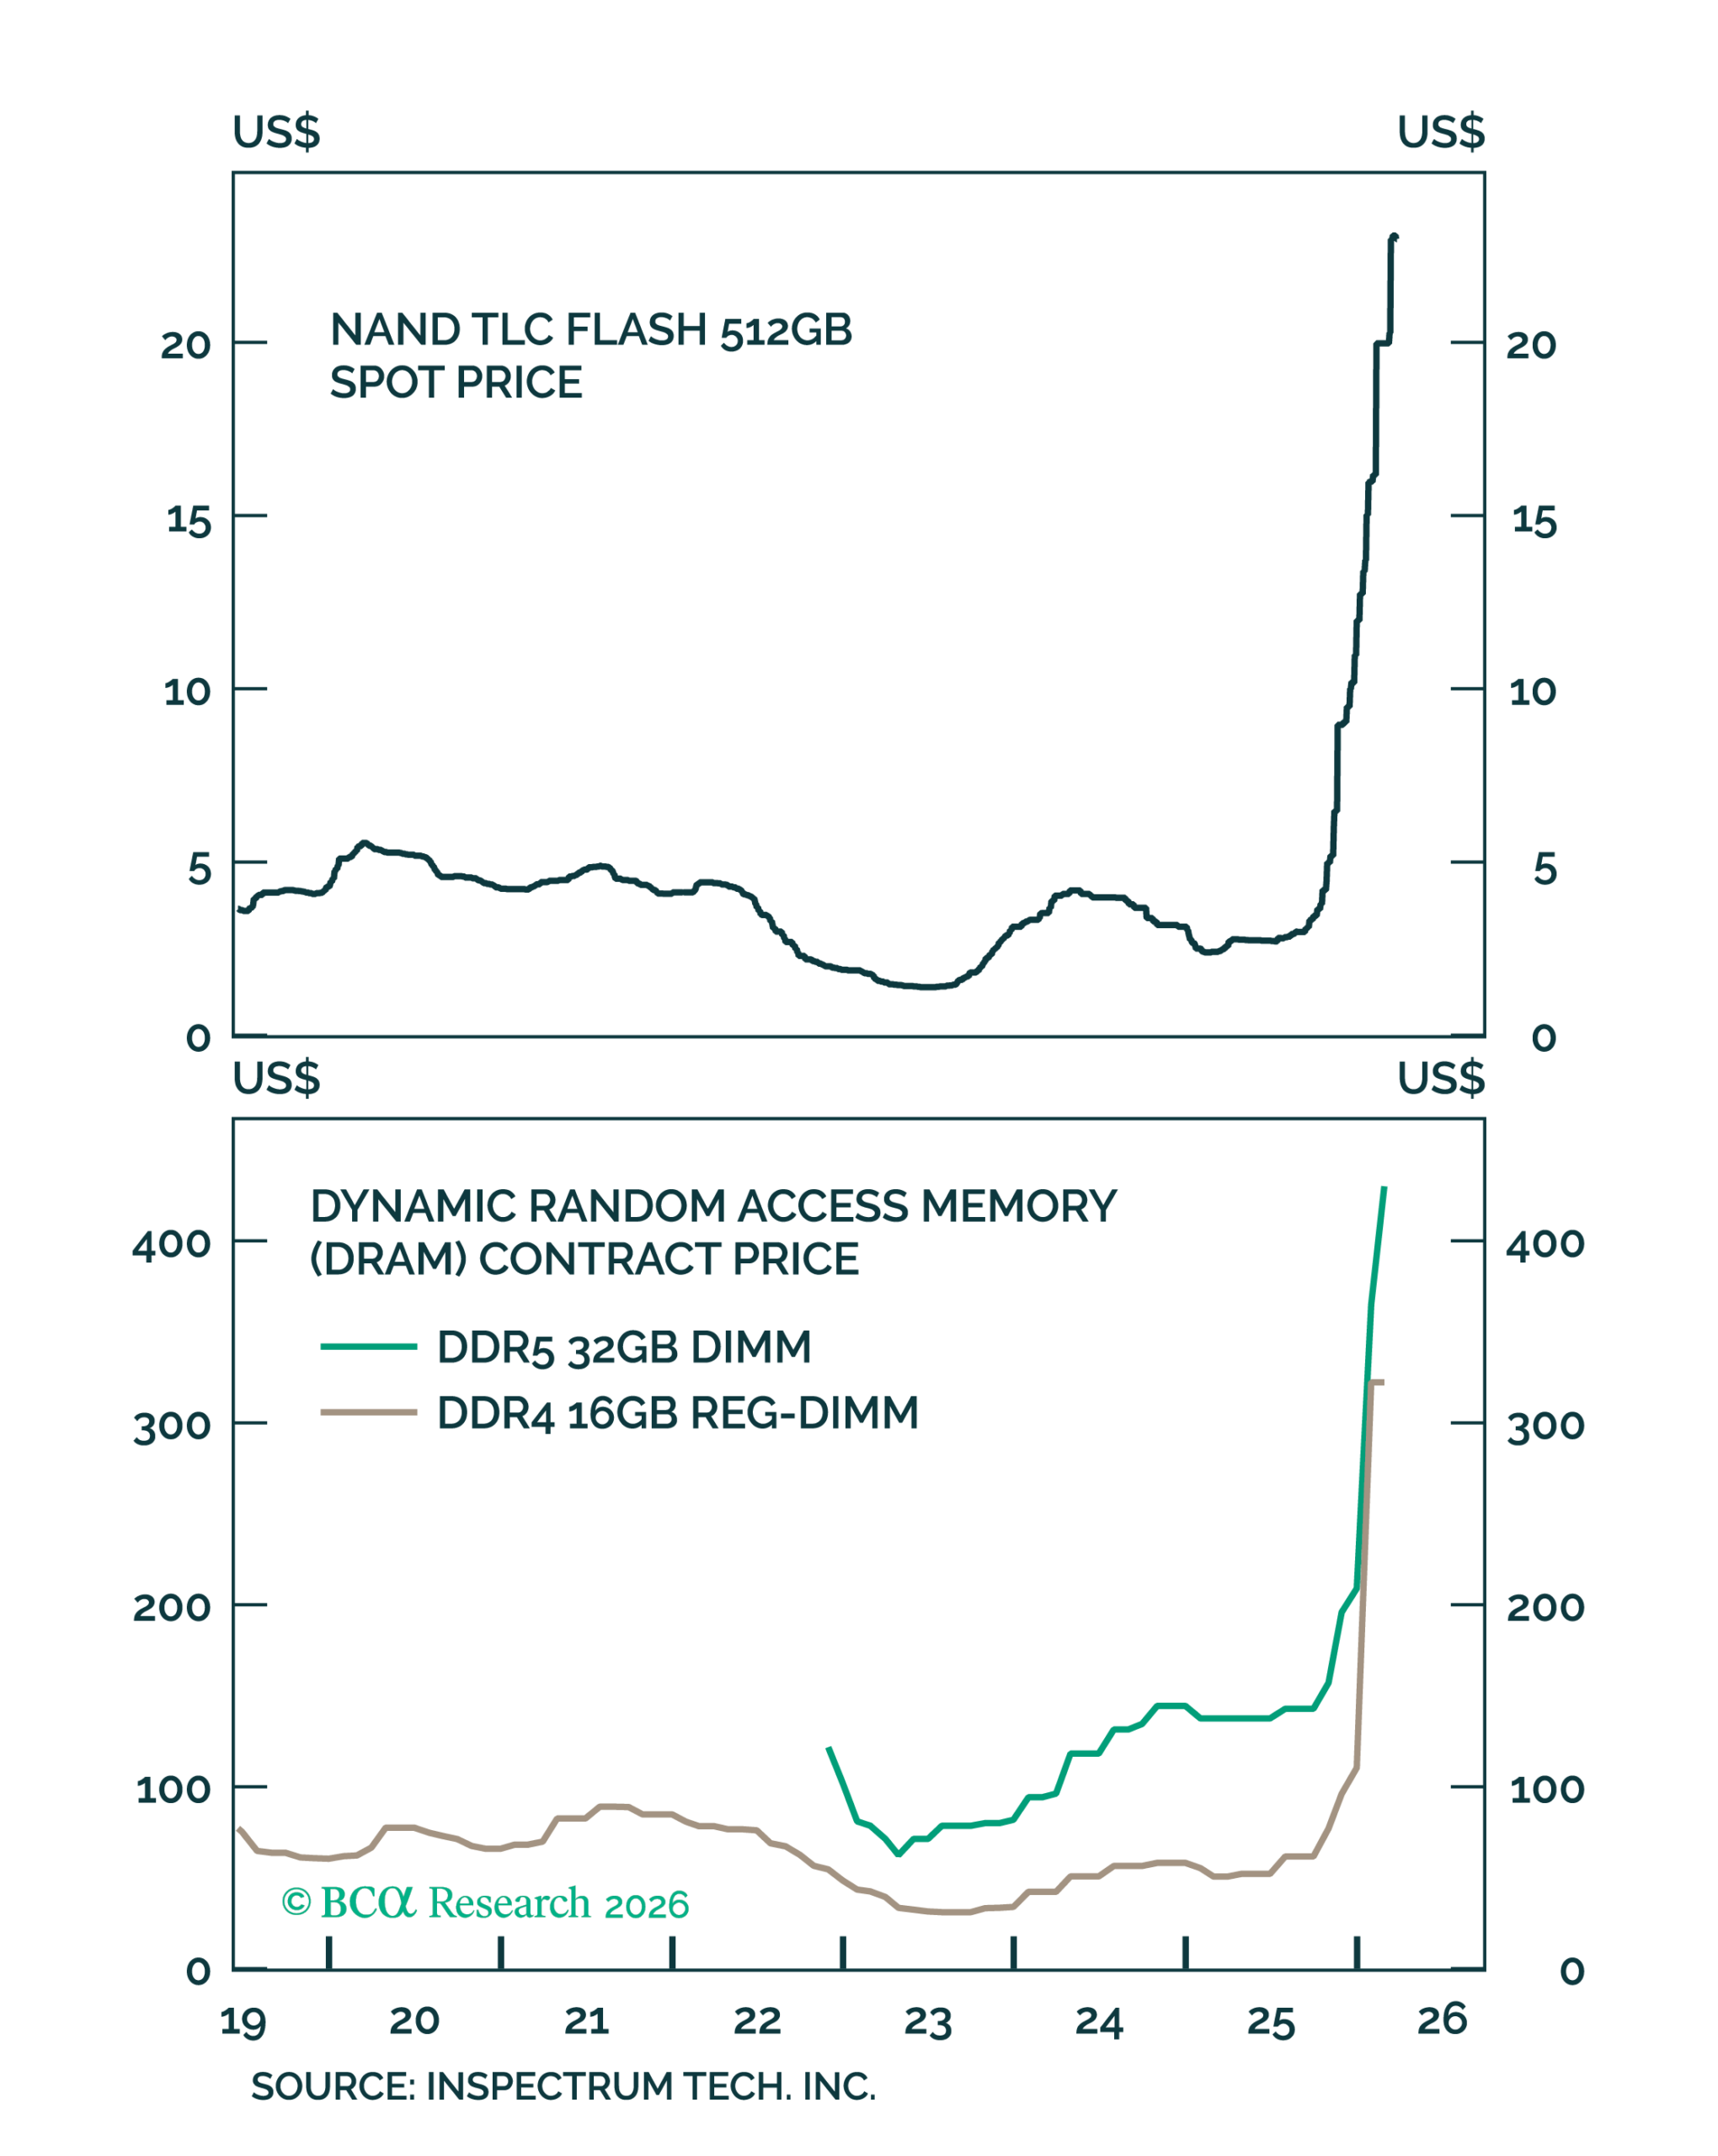
Figure 8 – The priority of AI inference has caused a surge in memory demand
There has clearly been a significant correction in AI-related valuations so far in 2026. This reflects growing concerns that the scale and pace of infrastructure investment may be outstripping near-term demand, raising fears that the buildout could prove too large, too early. This being said, there are signs that the AI buildout still has legs, following the alure of agentic AI. This has resulted in a resurgence in rental rates as inference compute is sought (AI agents are far heavier in inference costs than simple prompting), as well as a significant spike in memory costs (memory is relatively more important for chips used on inference tasks, versus training) – see Figure 8.
Logic does dictate that a first mover advantage makes sense in a datacentre buildout. Initial buildouts capture the primary wave of AI adoption, and the economies of scale provide barriers to entry for the massive players who retain long-term contracts with both the chip sellers like Nvidia, and the users of compute such as OpenAI. However, we cannot be overly reliant on conventional wisdom, given the fallacy of the argument against the software trade. Not long ago, markets believed AI would benefit software companies by significantly reducing programming costs. While this has largely proven true, it has also lowered programming costs for everyone else, including the customers of those software firms. As a result, investors increasingly began to worry that, instead of paying for expensive software products, more companies might simply ask Claude to build a bespoke solution for them.
Investment Takeaway
The first takeaway from the recent correction in the AI trade is a moderately tempered concern on AI’s priced-to-perfection dynamic, as the market has broadened in the interim.
Secondly, the new prioritisation of inference-first compute in the AI trade may likely also tame our concern regarding the attitude of “sky-is-the-limit” pricing in AI valuations. This comes as AI players begin allocating more airtime to supplying and monetising artificial personal assistants, rather than throwing all attention to achieving AGI at all costs, an endeavour that is undefinable at present.
What remains a concern, is the effect that the past correction (as well as further declines) in AI valuations will have on household wealth, and how this may impact consumption activity in future quarters. Given there remains inflationary risks seeping into the US, the central bank may have their hands tied in fighting against the marginal propensity to consume (“MPC”) risk brought on by any further corrections in the AI/tech market.

Figure 9 – The tech outlook dictates the S&P 500 outlook
Broadly speaking, technology companies now represent 44% of the S&P 500’s market capitalisation, surpassing even the peak levels observed during the dot-com bubble – see Figure 9. At the beginning of this year, US households held approximately $70 trillion in equity wealth (around 220% of GDP) compared with $13 trillion (130% of GDP) in 2000.
A rough rule of thumb is that a $1 change in equity wealth translates into a $0.04 (four cents) change in consumption. A sustained 20% decline in equity prices would reduce household wealth by roughly $14 trillion. This, in turn, could lower consumer spending by about $560 billion, or a -1.8% decline in GDP, a contraction that is potentially sufficient to trigger a recession.
This fits within the two-phase bear market theory, as a tech recession first leads the broader market, inducing bearish economic indicators. This leads to a feedback loop that ultimately brings pressure to the rest of the market. This, alongside various other late-stage cycle indicators, warrants a defensive stance as we monitor how the Iran ceasefire plays out.
If you are interested in finding out more about how cognisance of the macroeconomic backdrop impacts our investment decision making process, connect with Integrity Asset Management and let us help you navigate your investing journey.
For more information on this synopsis or to discuss solutions provided by Integrity Asset Management, please contact us at:
Tel: (021) 671 2112
Cell: 072 513 2684 / 084 601 1025
E-mail: nic@integrityam.co.za / herman@integrityam.co.za
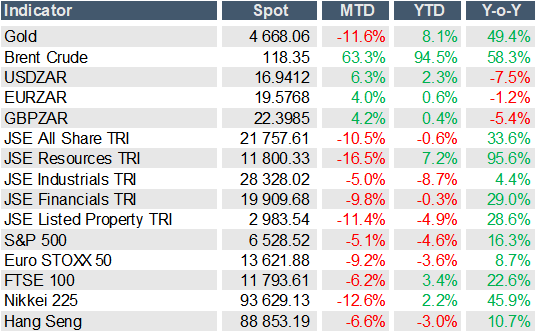
Source: Bloomberg, 31 March 2026