
The second leg is the one that bites
Brent crude opened July at $72 a barrel and closed the 23rd at $99. But in reality, this round trip is not the focus of the oil story. What matters more right now is the crack spread, as the products refined out of that barrel have risen roughly twice as much as the barrel itself, which makes this a materially different shock to the one that markets spent the first half of the year learning to price
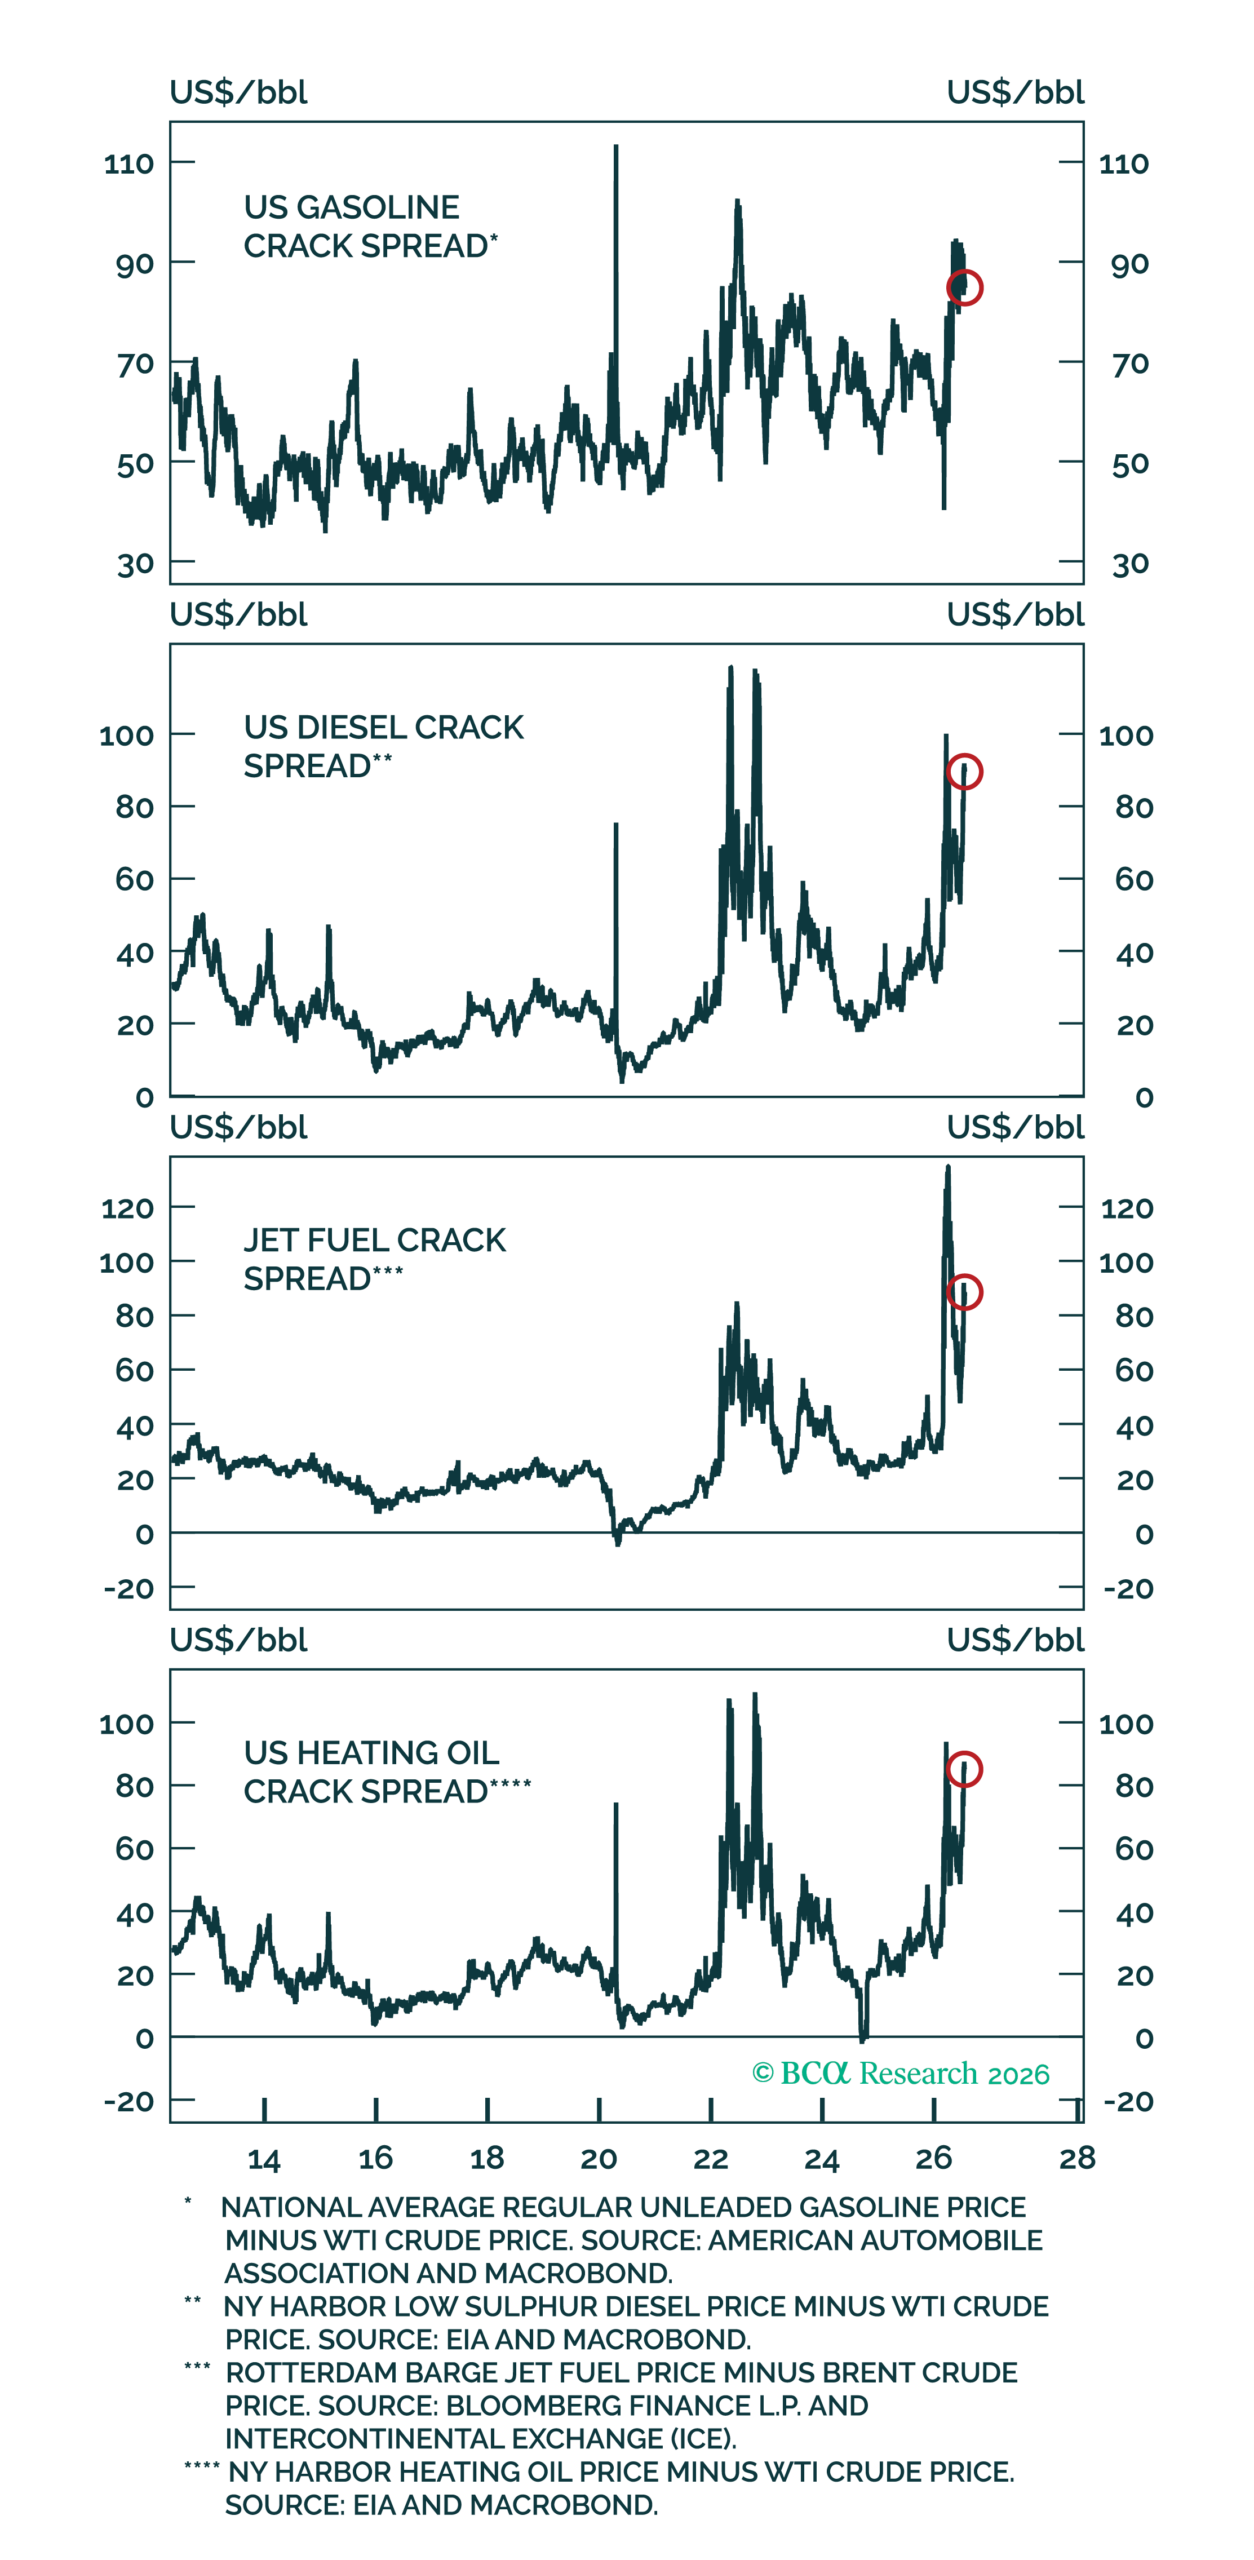
Figure 1 – Crack spreads have widened
March’s outbreak was a crude supply shock in the textbook sense, in that barrels could not physically leave the Gulf, and so the rising crude price did the work of rationing demand. The second leg of the story experienced in July has a different constraint, and this sits downstream. The crack spread refers to the gap between the price of a barrel of crude and the combined price of the refined products made from it. It is effectively the refiner’s margin, and it widens when the bottleneck is processing (refining) capacity rather than crude supply. Ukraine’s recent attacks on Russian refining installations have taken capacity offline at the same moment that crude itself is being rationed. As a result, the raw material shortage has migrated into the finished products – see Figure 1.
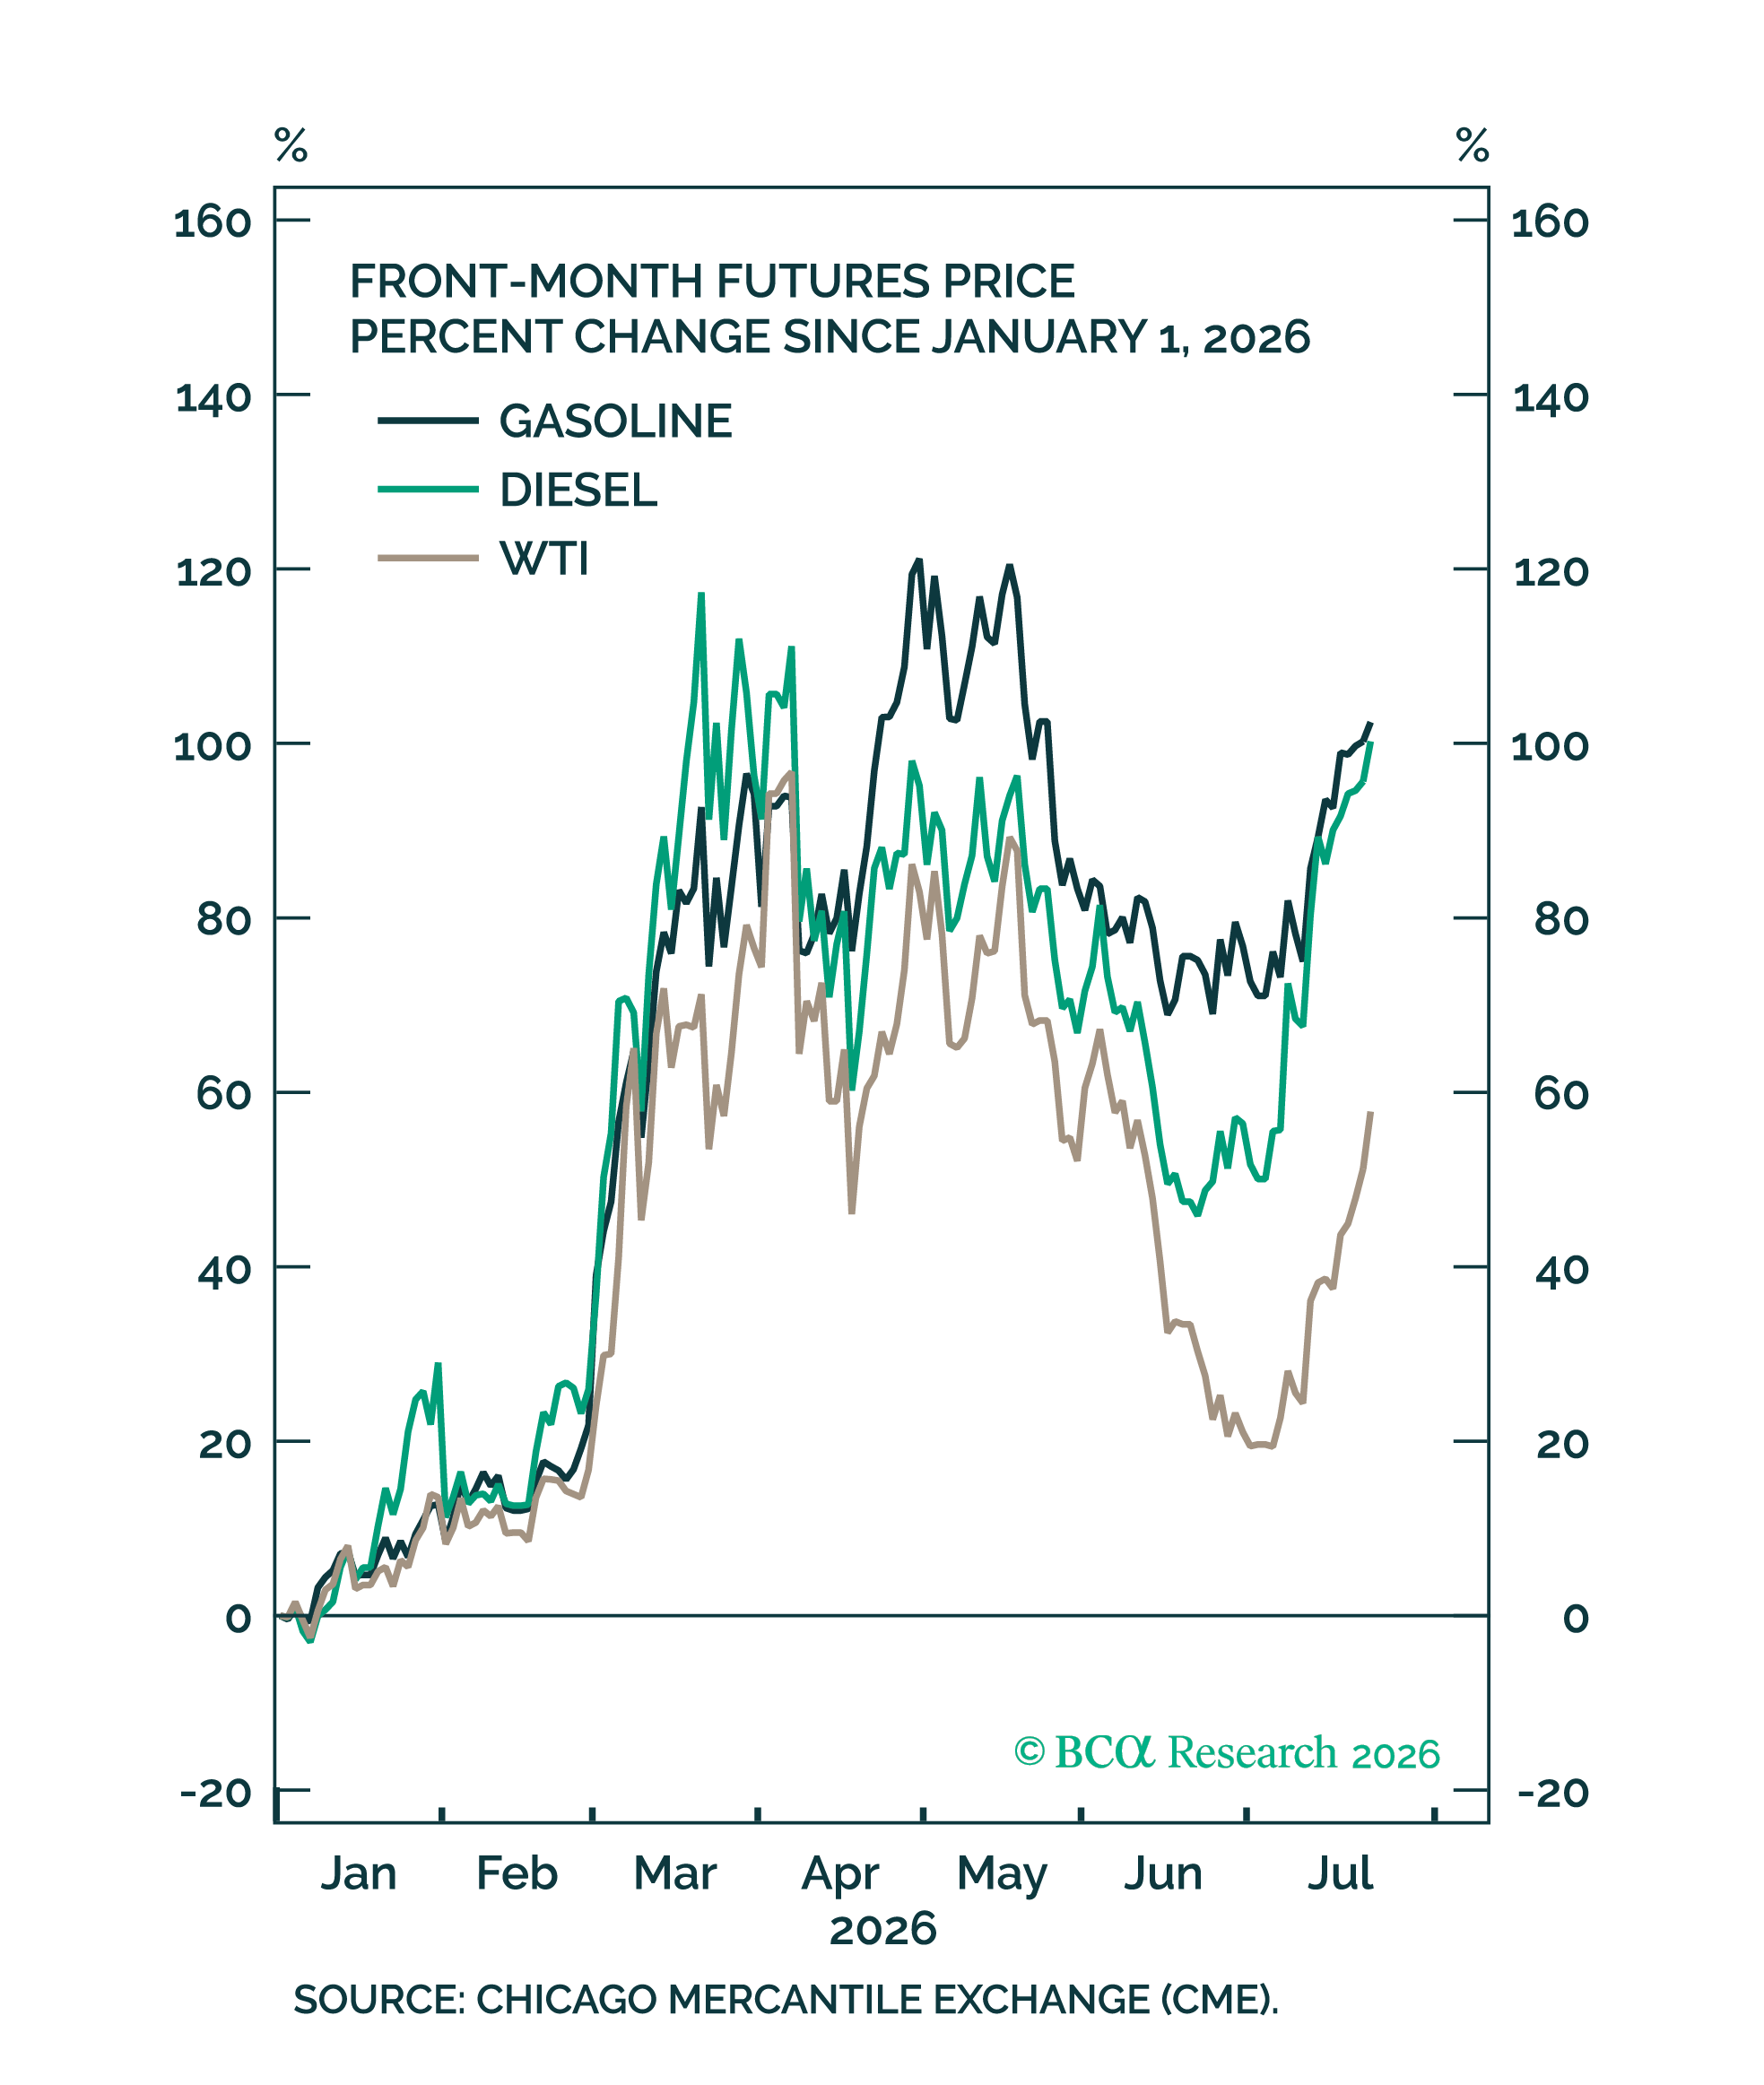
Figure 2 – Gasoline and diesel prices have risen more than WTI
Fuel prices reiterate the above point clearly. Year-to-date, West Texas Intermediate (“WTI”) crude remains up 58%, while gasoline futures are up 102% and diesel futures up 100% – see Figure 2. It is worth mentioning that households and firms do not buy WTI. They buy petrol, diesel, jet fuel and heating oil. The pass-through stress to real incomes is therefore running at roughly double what would be assumed if looking only at the crude headline figure.
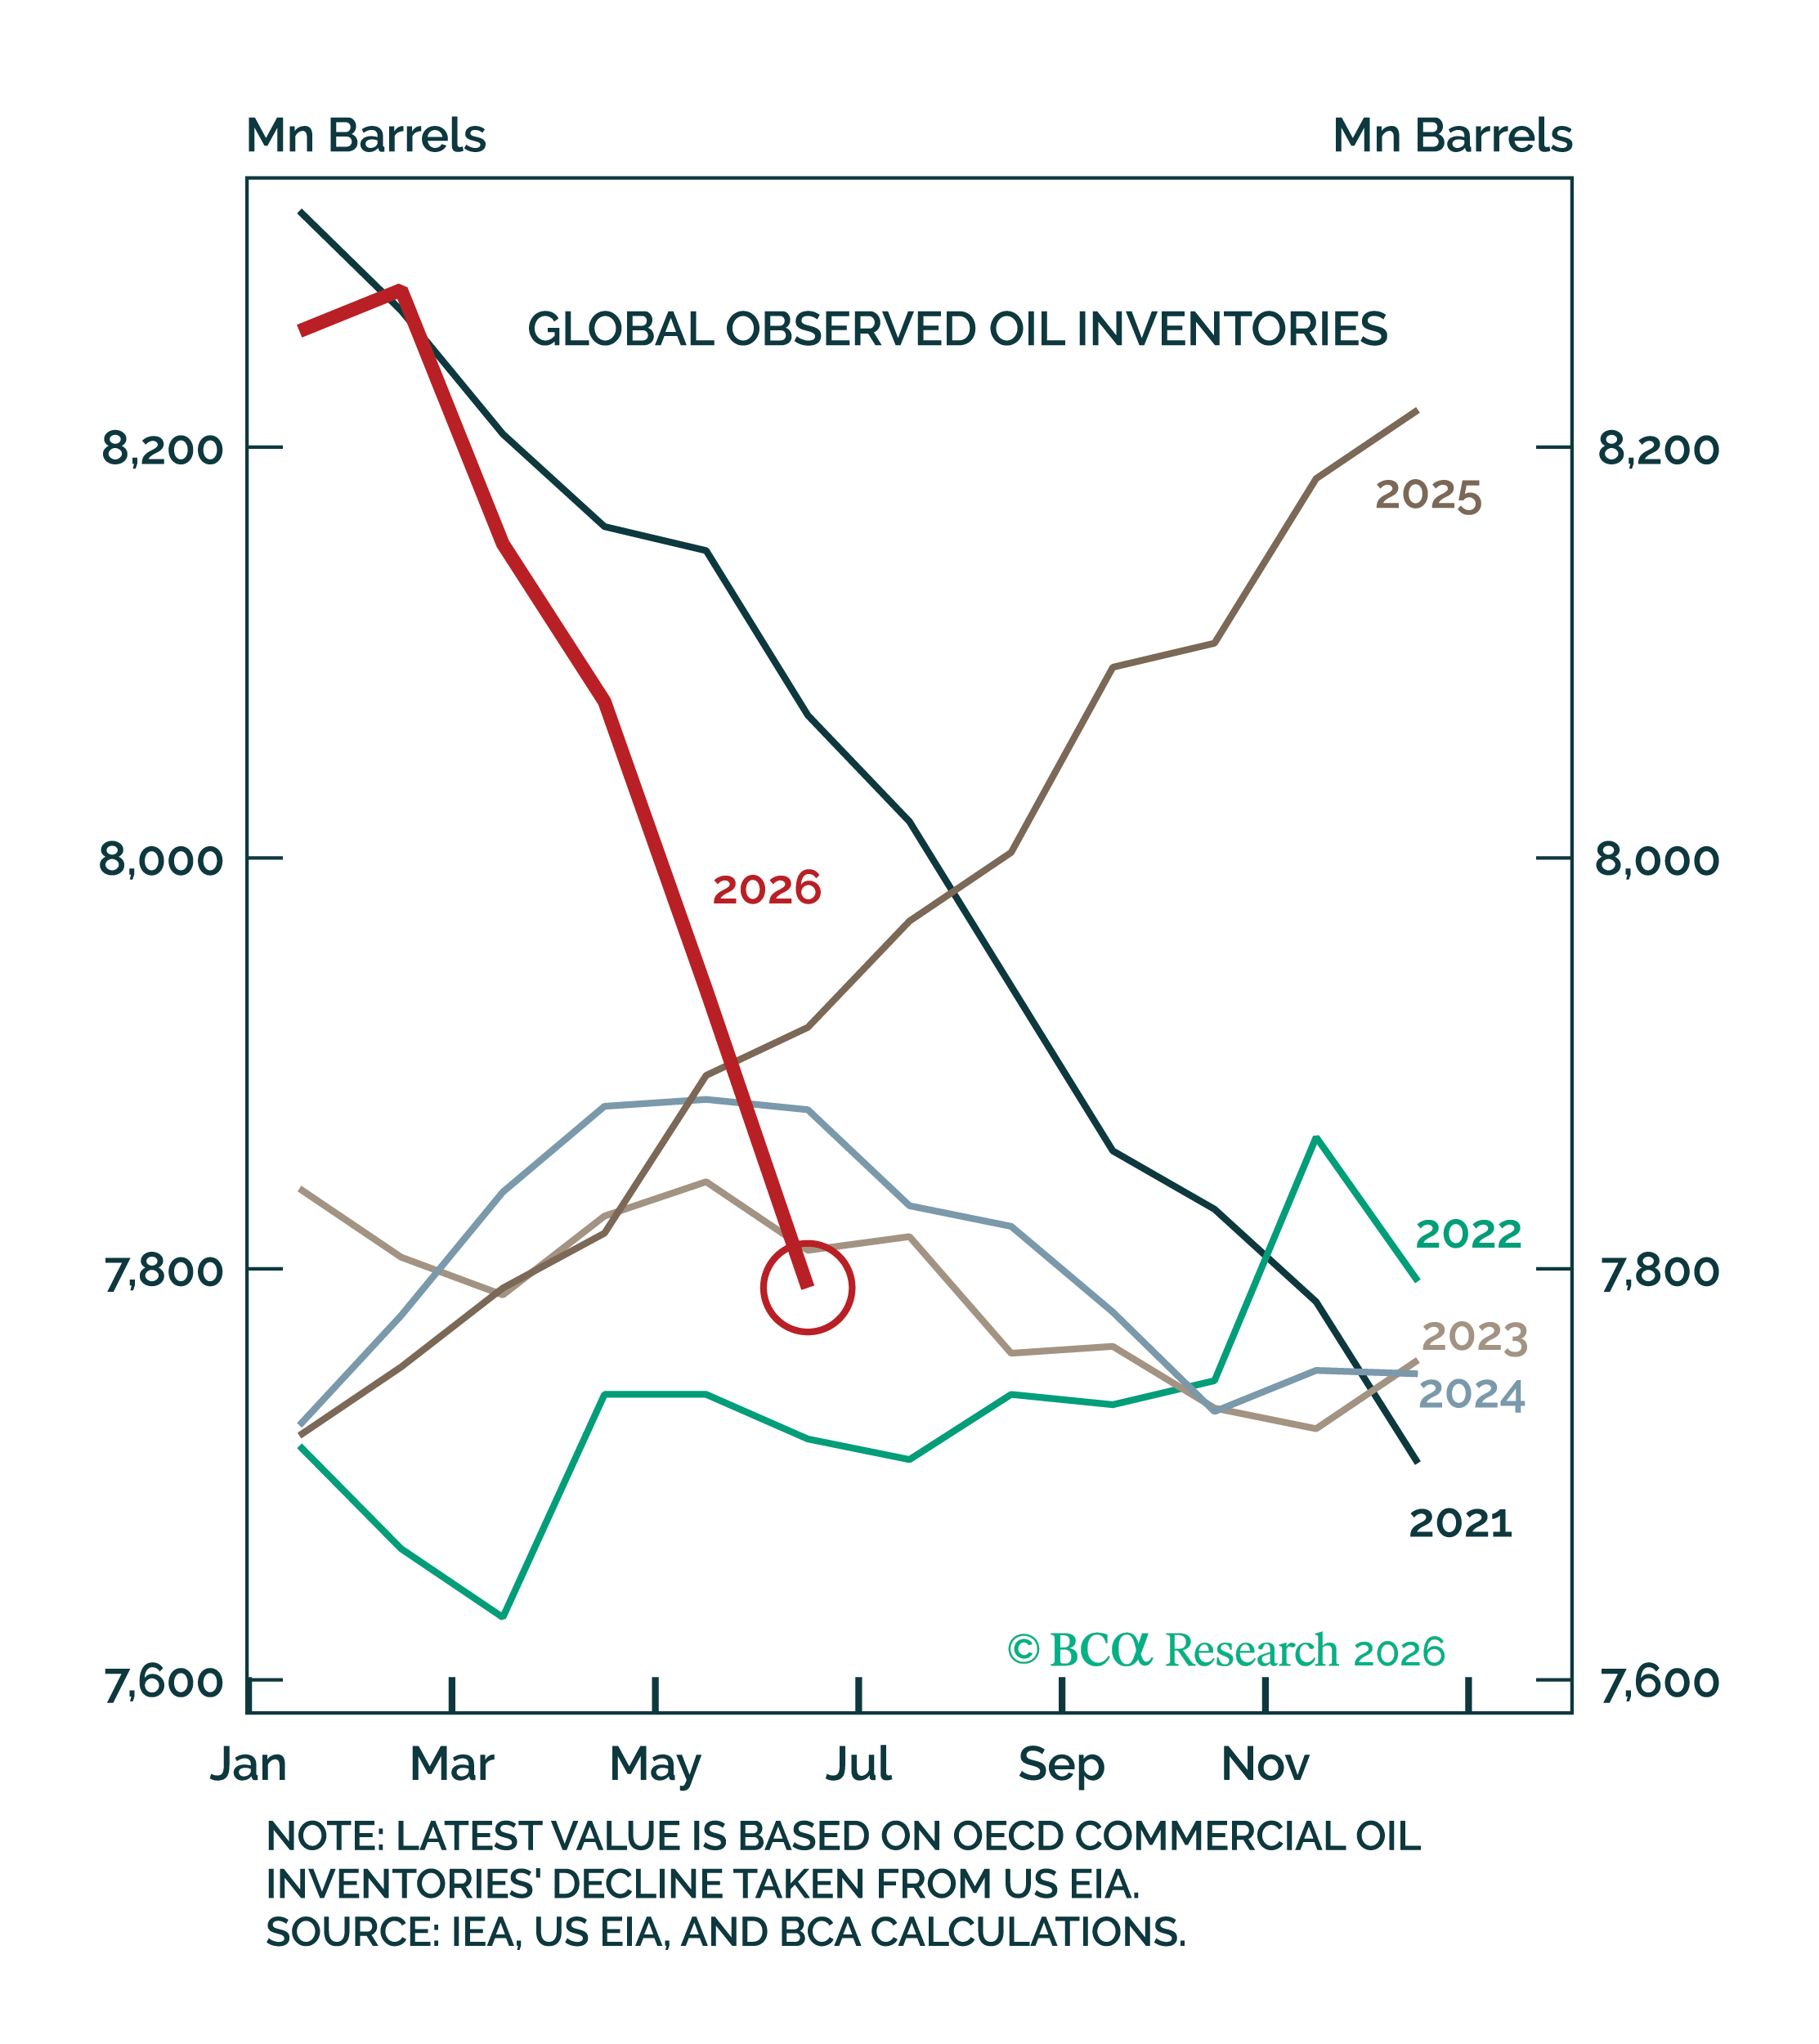
Figure 3 – Global oil inventories continue to drop rapidly
The second mechanism in the oil story is the inventory buffer, and it is here where the recent political language around this conflict has made the economic implication ambiguous. Describing the Gulf standoff as a “new equilibrium” is a misuse of the word, given that an equilibrium by definition is a state that can persist. Global observed inventories are still falling rapidly, and are on track to end the year at a 5-year low if the current trend persists – see Figure 3. Inventories exist to absorb the gap between what is delivered and what is consumed. While that buffer is draining, price does not have to do the rationing. Once stocks approach minimum operating levels, price is left to do all of it at once, with estimates putting that moment at the end of this year or early 2027 unless strait traffic recovers. A stalemate is therefore a countdown rather than a steady state.
A new regime for growth
The oil price has been primarily a commodity story over the last few months. This quickly becomes a story of contagion once second-order effects truly kick in, an inevitable probability the longer the war persists. It is an input cost to every producer that moves, heats or makes something physical, and it is a non-discretionary line item for the majority of households.

Figure 4 – Manufacturing activity has strengthened recently, while services have faltered
Consensus 2026 GDP forecasts have fallen almost everywhere, with the euro area cut from 1.2% at the start of the year to 0.6%, and the US remaining the only major developed economy revised upward. Although, beneath the headline, manufacturing PMIs have strengthened while services PMIs have weakened – see Figure 4. This is the reverse of the usual arrangement, where services provide the stable base and manufacturing supplies the cyclical swing. The explanation matters more than the observation itself. Services are absorbing the fuel squeeze directly, because every dollar spent at the pump is a dollar not spent on a discretionary service. Manufacturing, on the other hand, is being propped up by three things:
- Precautionary ordering from firms hedging supply chain disruption,
- AI-driven demand for semiconductors and electrical equipment, and
- The immediate expensing of capital equipment under the One Big Beautiful Bill Act (“OBBBA”).
Importantly, two of those three merely pull demand forward rather than create it, which does beg the question that US manufacturing strength could be less durable than it looks on the current snapshot.
No cushion left

Figure 5 – Spending growth has exceeded income growth in the US thanks to a decline in the saving rate
The US consumer has been the offsetting force so far, but that offset is being financed rather than earned. Real personal consumption is up 2.0% since Liberation Day while real disposable income has contracted 0.8% (and this is despite $50 billion in additional tax refunds under the OBBBA) – see Figure 5. The gap has to come from somewhere, and it is coming out of the saving rate, which sat at 3% in May.

Figure 6 – Outstanding balances under home equity lines of credit are a shadow of what they were during the housing bubble
The obvious rebuttal on this bear point is that the saving rate fell below 2% during the Global Financial Crisis (“GFC”) housing bubble, so 3% is hardly a certain signpost of impending consumer stress in today’s regime. However, the housing bubble era that only broke under a 2.0% saving threshold ran on home equity lines of credit (“HELOCs”). HELOCs allowed households to convert house price appreciation into spendable cash without having to sell the house, effectively turning a paper wealth gain into actual cash flow. This was the structural tool in the toolbox that allowed households of the prior bubble to survive for longer. Today, consumers either avoid this feature due to GFC trauma or simply do not have that same safety buffer. The K-shaped nature of the current economy means recent housing wealth gains have accrued disproportionately to higher-income households rather than the median homeowner, leaving a growing share of households unable to monetize housing wealth in the way they could during the prior cycle. Consistent with this, HELOC balances today stand at just 1.4% of GDP versus the Q2 2009 peak of 5.0% – see Figure 6. Thus, a breach of the 3% saving threshold should remain a red flag in the economic checklist, and that the US may be balancing upon the last bastion of a sustainable savings level.

Figure 7 – Consumer delinquency rates are near their GFC highs
Adjacent to this, delinquency rates on credit card, auto and student debt sit near their Global Financial Crisis highs – see Figure 7. The frequently cited counterpoint is that aggregate household leverage is low. However, this aggregate is dominated by mortgage debt, which is long-dated, fixed-rate, and held disproportionately by higher-income households. It therefore says almost nothing about the marginal borrower, who sits in the median household and is the swing factor in consumption growth. Card and auto debt is where this marginal borrower actually lives, and there the stress is at cycle-peak levels.
The savings versus credit story leaves a risky loop. With the lower leg of the K tapped out, the only remaining route to a lower saving rate is for wealthier households, who hold the bulk of equity wealth, to spend even more. That in turn requires further equity gains, which requires further upgrades to earnings estimates, all from a starting point where margins are already at record highs. US consumption has effectively become levered to the index at the same moment that the index has become levered to earnings driven by a single story (the AI trade).

Figure 8 – Real unit labour costs are falling in the US
Given that diesel has doubled, the striking thing is that inflation expectations have not budged. It bears remembering the simple mechanics at play: An oil shock raises the price level mechanically, but it only becomes sustained inflation if workers can win compensating wage increases, which is what starts the second round. That channel is currently blocked. Labour market slack has widened, real wage growth is close to zero across the G7, and US real unit labour costs fell 2.7% year-on-year in Q1 – see Figure 8. The sting in the tail is that the same absence of wage pressure keeping inflation contained is exactly what has been flattering corporate profit margins.
Margins and the depreciation clock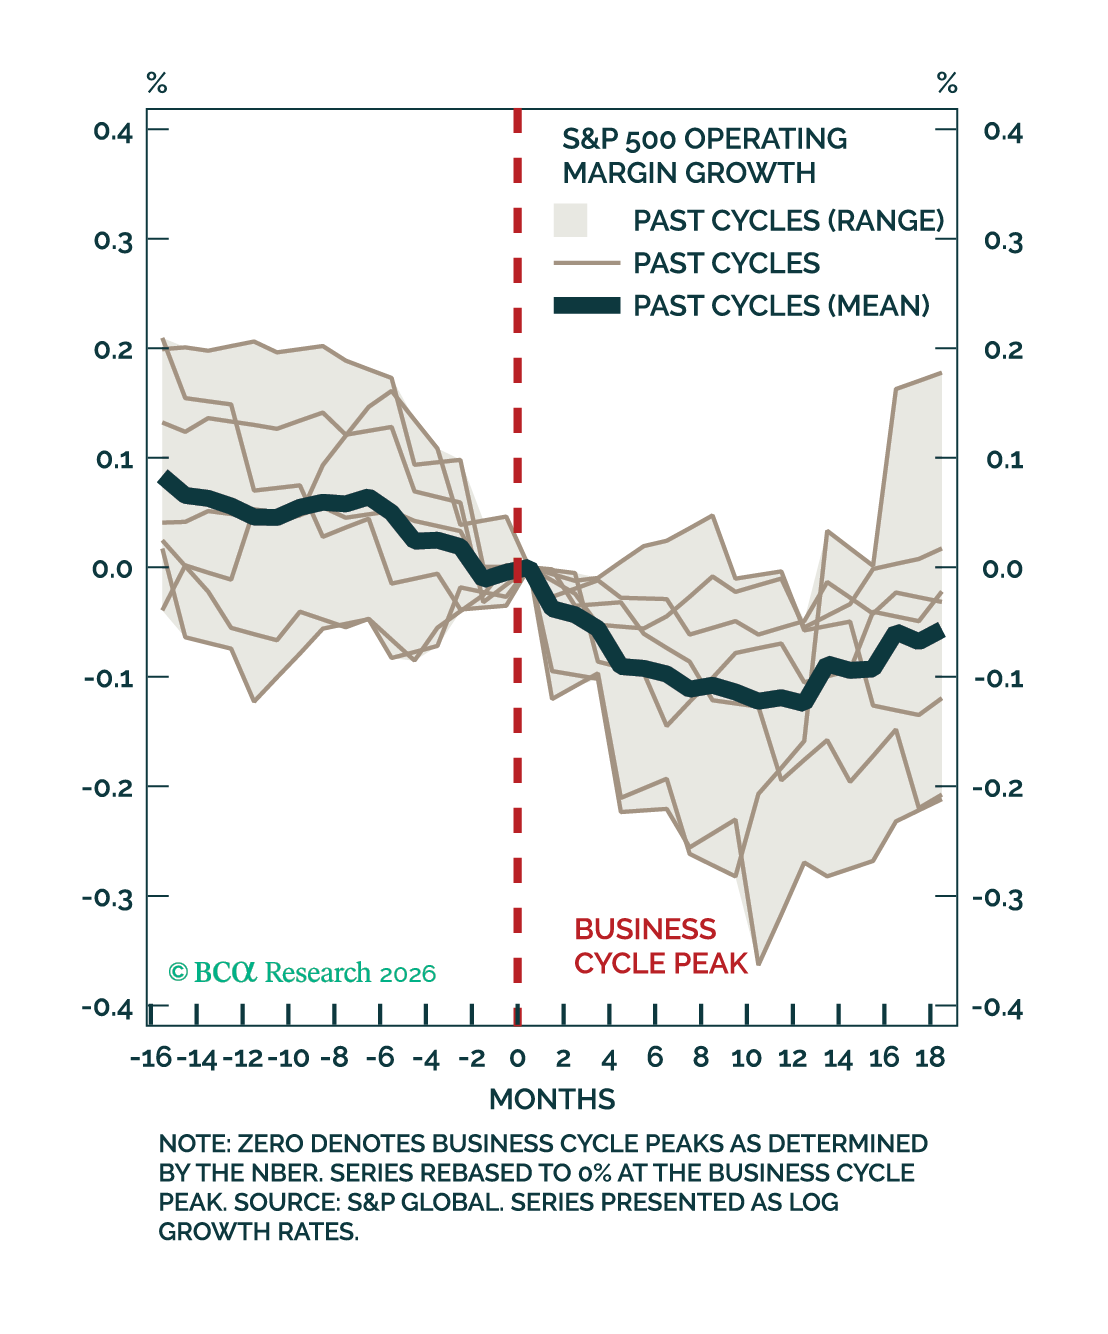
Figure 9 – Margins tend to peak before recessions
Economy-wide margins generally decline in the lead-up to recessions – see Figure 9. There are three reasons for this, and together they function as a useful checklist. Late expansions tend to overheat, so wage growth outruns productivity and real unit labour costs accelerate against margins. Real business sales decelerate, which degrades operating leverage, because fixed costs do not fall with volume, so each lost unit of sales removes revenue but not cost. Lastly, financial sector margins compress as the curve flattens and charge-offs rise. Score the current cycle against these and not one has triggered, with real business sales up 3.5% year-on-year and real unit labour costs outright negative.
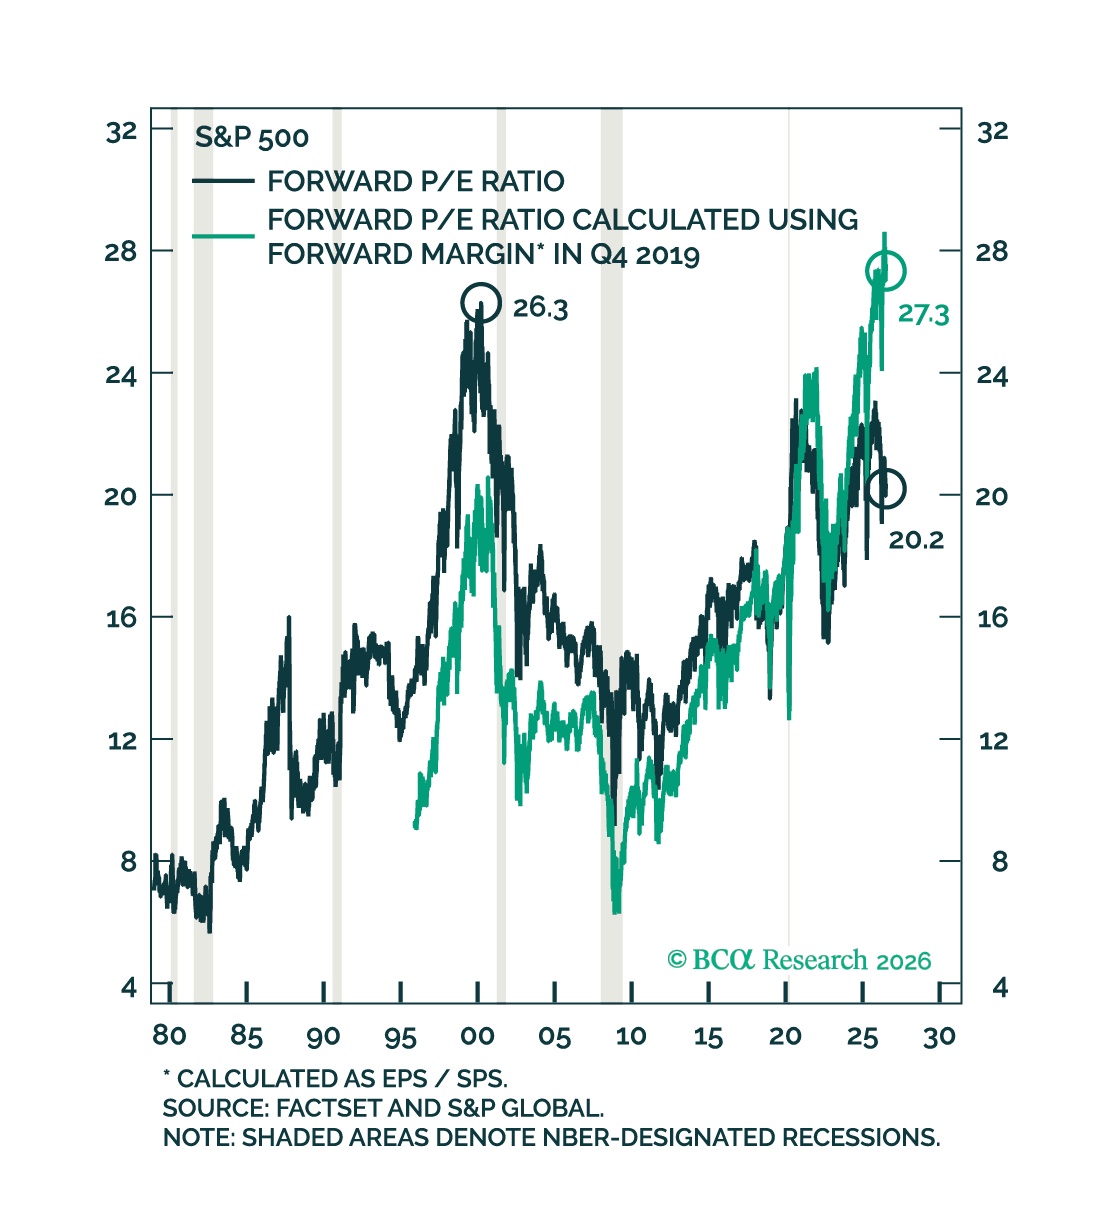
Figure 10 – The S&P forward P/E ratio would be much higher if margins had not risen
None of that says margins are about to turn. What it does say is that the whole valuation case rests on them not turning. The forward P/E of 20.2 appears elevated but not extraordinary, yet recompute it using the profit margins that prevailed in Q4 2019 and the index trades at 27.3 times forward earnings, above the 26.3 times reached in March 2000 – see Figure 10. The market only looks tolerably priced because earnings themselves have been lifted by a margin expansion that is currently being treated as permanent.
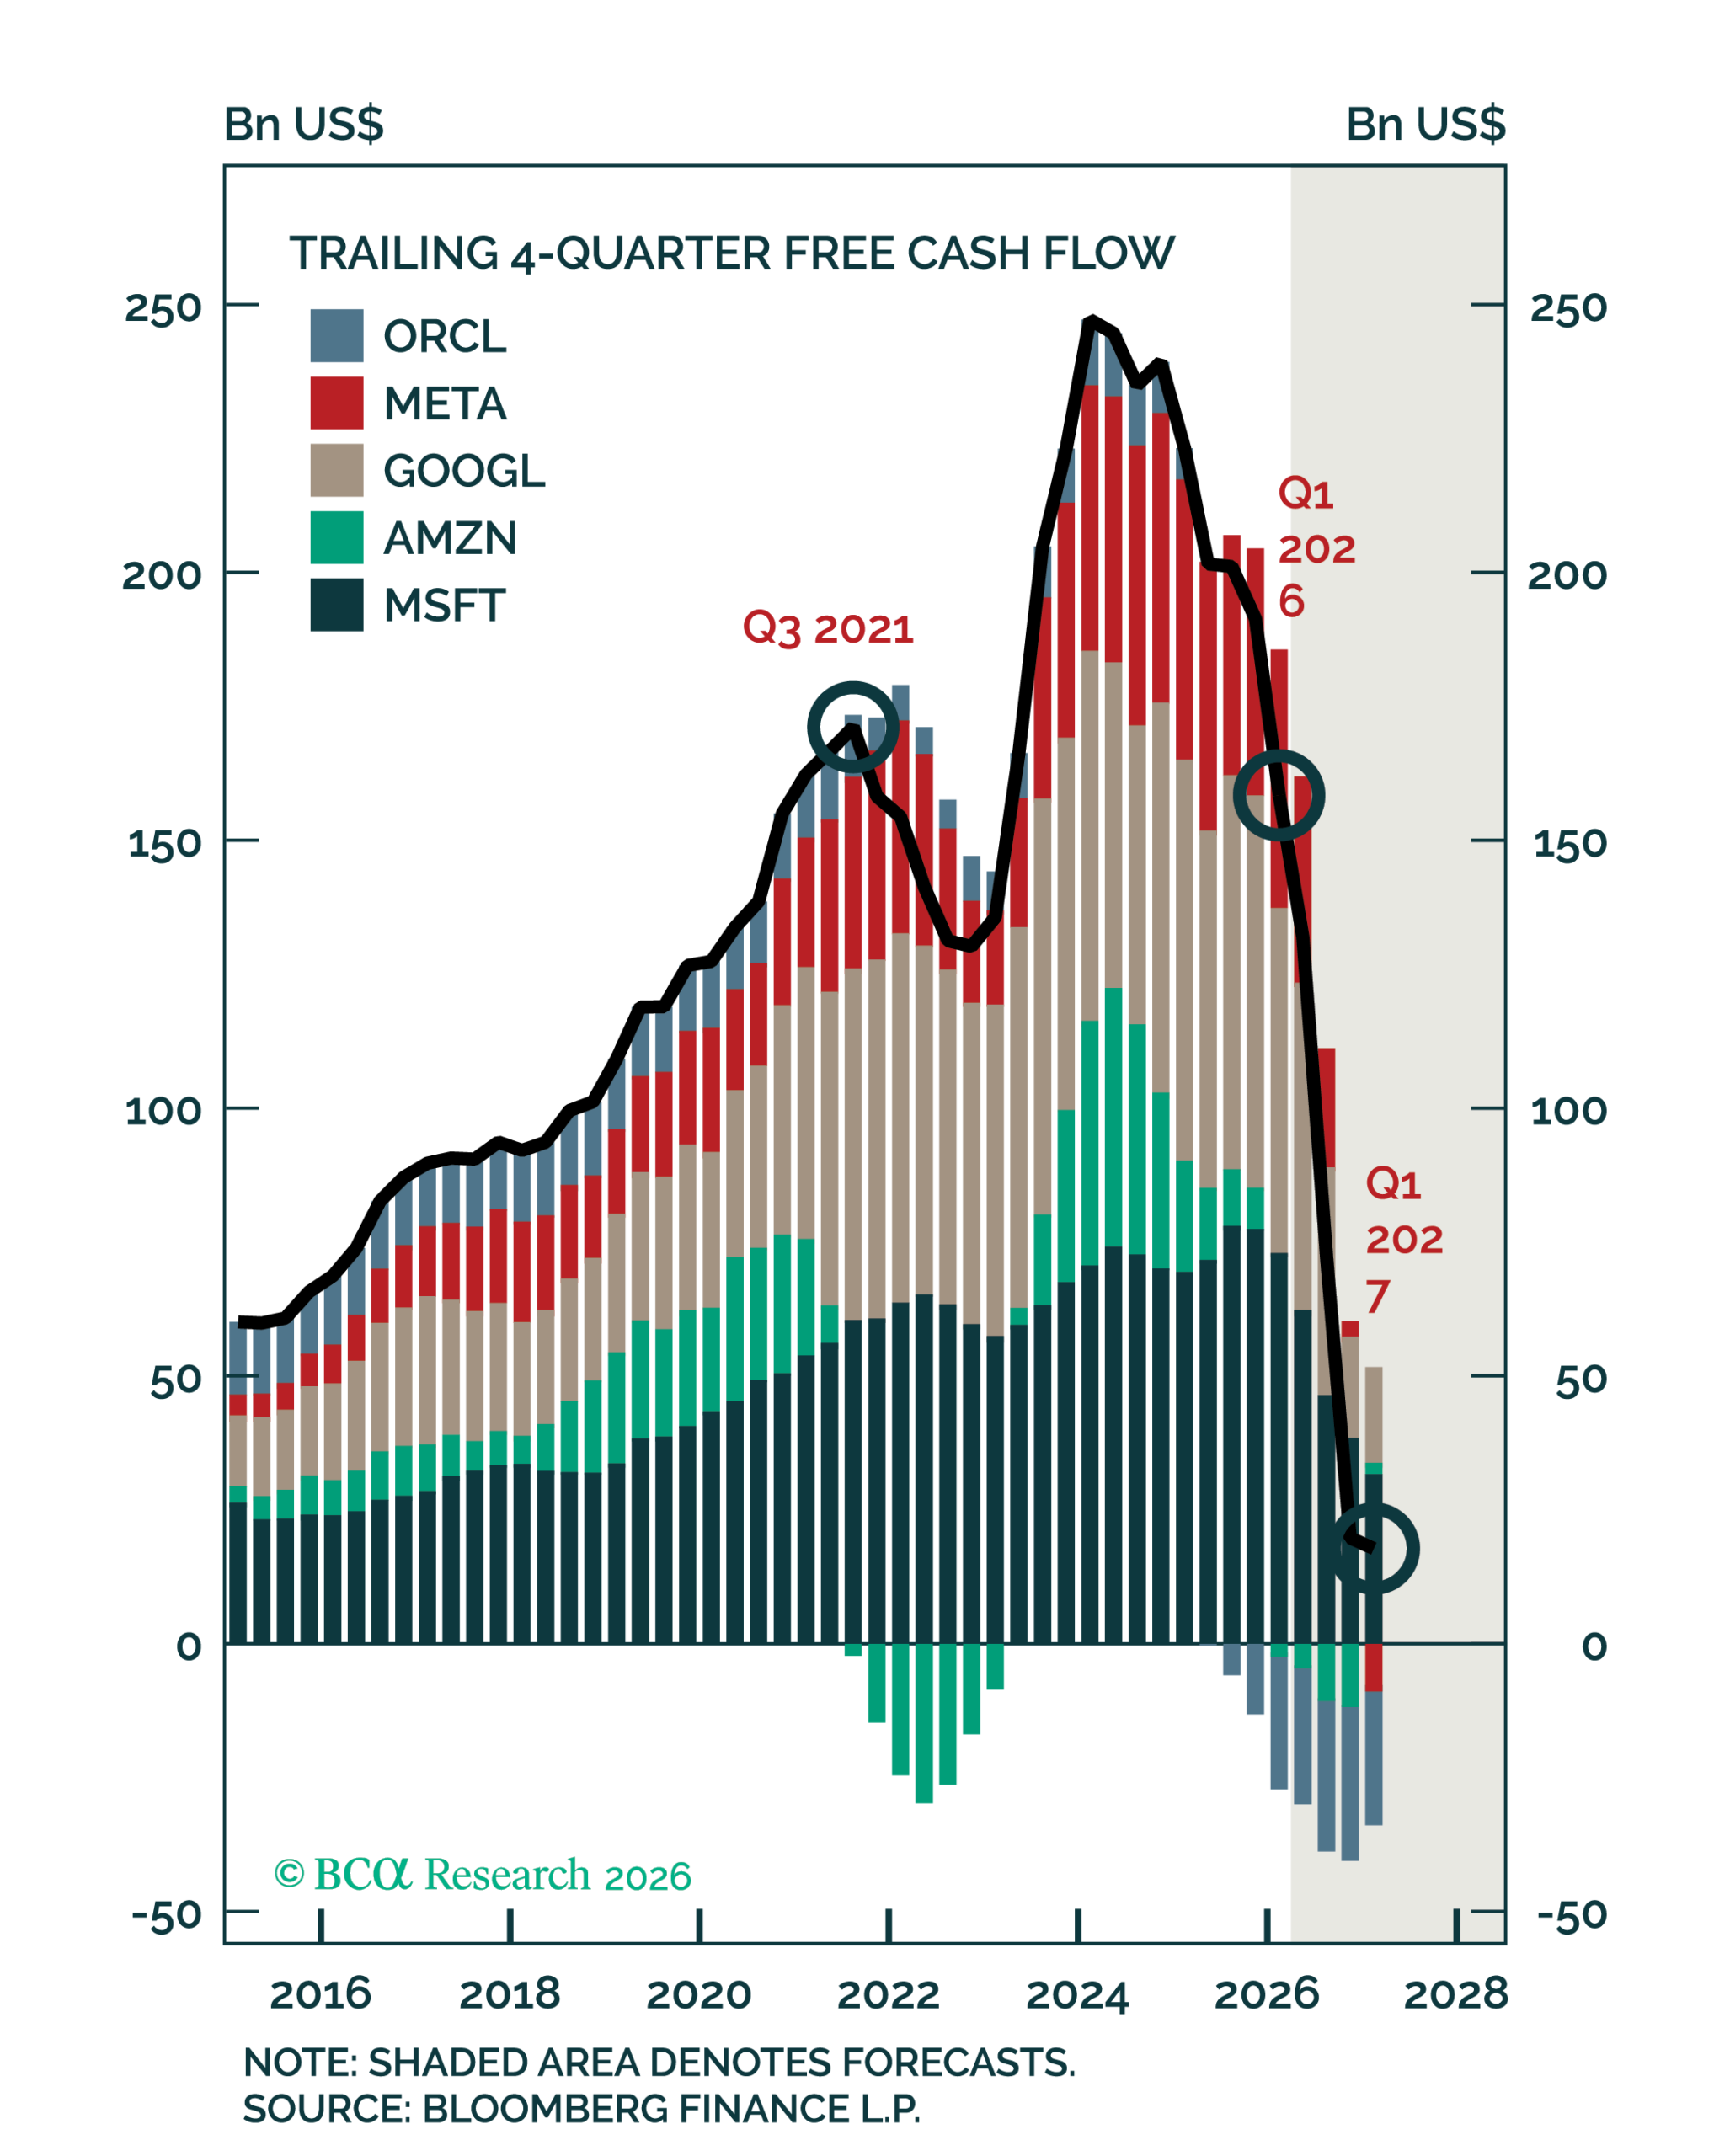
Figure 11 – Hyperscaler free cash flow is rolling over
Part of this margin expansion is the accounting asymmetry we have covered before in a prior synopsis, now simply at greater scale, with hyperscaler capex set to reach $740 billion this year versus $425 billion in 2025. The useful development this month is that a vague worry has become a datable one. Hyperscalers are on pace to hold roughly $2.5 trillion in AI-related assets by 2029-2030. At a 20% depreciation rate (the typical rate at which chips are currently recognised), this implies close to $500 billion a year in depreciation charges, set against combined hyperscaler profits of about $400 billion today. Capitalising a cost does not make it disappear; it merely lags its recognition on the bottom line. Cash leaves the business when the asset is bought, while the earnings hit arrives in instalments of depreciation afterwards. This is why free cash flow deteriorates first and profits later, and why hyperscaler trailing free cash flow has already rolled over from its 2024 peak even as reported profits remain strong – see Figure 11. The telecom capex cycle of 2000-01 followed the identical sequence.
Investment takeaway
The trap around AI margins may be symmetric. If AI spending slows, margins decline for the many companies currently benefiting from it. If the boom instead intensifies, the economy overheats and labour costs lift, so margins decline through the unit cost channel regardless. The oil story simply adds a third potential path, in which margins fall without AI doing anything at all, should the war persist and the inventory drawdown runs its full path.
That being said, the counterpoint to an AI bear market is far from trivial. Cloud backlogs have grown by roughly $750 billion in two quarters, which is money customers have already committed rather than potential demand someone has forecast. Taiwanese and Korean chipmakers have also kept capacity additions within historical norms, historically the single factor most responsible for turning semiconductor booms into busts. Hyperscaler interest expense as a share of EBIT remains low too, meaning this buildout is still funded from cash flow rather than leverage.
Even granting all of that, the AI debate is only one of the two pressures on margins this year. The refining shortage raises input costs across the physical economy at a point where the consumer has no savings buffer left to absorb a pass-through, and that squeeze operates regardless of what happens to compute demand. Margins are the variable where both stories eventually settle, and they are currently priced as though neither exists.
If you are interested in finding out more about how cognisance of the macroeconomic backdrop impacts our investment decision making process, connect with Integrity Asset Management and let us help you navigate your investing journey.
For more information on this synopsis or to discuss solutions provided by Integrity Asset Management, please contact us at:
Tel: (021) 671 2112
Cell: 072 513 2684 / 084 601 1025
E-mail: nic@integrityam.co.za / herman@integrityam.co.za
Source: Bloomberg, 31 July 2026