
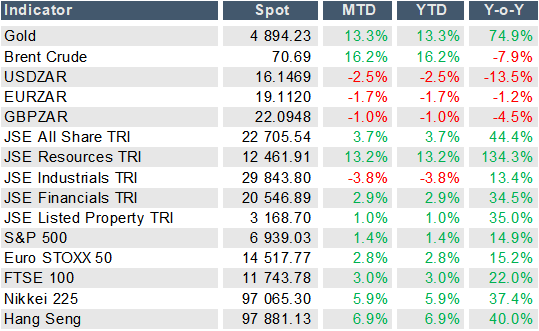
Three developments shaped the narrative over the last month: A pause in Federal Reserve (“Fed”) easing, President Trump’s announcement of a new Fed Chair nominee, and a sharp selloff in commodity markets. Silver’s price action stood out, falling 33% initially. Given the exponential leadup, the move could be interpreted as a signal of waning risk appetite rather than a supply-driven shock.
Just prior to this selloff, the Fed elected to hold its policy rate unchanged at the 3.5% to 3.75% range, following a series of earlier cuts. The Fed funds rate has declined from 5.5% in September 2024 to the current upper bound of 3.75%, with markets pricing an additional 64 basis points of cuts over the next year. However, this easing has not yet translated into lower long-term borrowing costs. The 10-year Treasury yield, which stood at 3.65% ahead of the first rate cut in 2024, has risen to around 4.15%. The persistence of higher long-end yields could largely reflect the magnitude of the US fiscal deficit, with heavy Treasury issuance and growing debt sustainability concerns pushing the term premia higher.
Mortgage rates have remained broadly stable as narrower lending spreads have offset higher Treasury yields. Even so, housing activity has continued to weaken, highlighting the limited success of policy easing to interest-sensitive sectors so far.
Policy uncertainty has increased further following President Trump’s announcement that he intends to nominate former Fed Governor Kevin Warsh as the next Chair, someone with a historically hawkish reputation. However, his recent rhetoric has notably been more dovish. A shift in this direction would potentially result in a bull steepening of the yield curve, exacerbating the already wide spread between short- and long-dated bonds.
2001: A similar odyssey
Between March 2000 and May 2001, the S&P 500 IT index fell by 55%, while non-IT stocks gained roughly 10% – see Figure 1. As a result, the broader S&P 500 declined by a relatively modest 14%, in what amounted to the first phase of the bear market. Once the 2001 recession became evident, the downturn broadened materially, and the S&P 500 suffered a peak-to-trough decline of 49%.

Figure 1 – A rotation from tech to non-tech
A similar sequence could unfold if momentum behind AI adoption continues to fade. Multiple indicators, including AI adoption measures, GPU rental rates, and free cash flow trends, suggest that the AI super cycle may be normalising, if not maturing. Adoption data are already showing signs of levelling off, as reflected in Census Bureau surveys and the Ramp AI Index, which tracks the share of US firms paying for AI models, platforms, and tools – see Figure 2.

Figure 2 – AI adoptions rates stagnate
These trends are consistent with recent Brookings Institution research indicating that fewer than 5% of respondents believe access to AI models has meaningfully boosted productivity – see Figure 3.
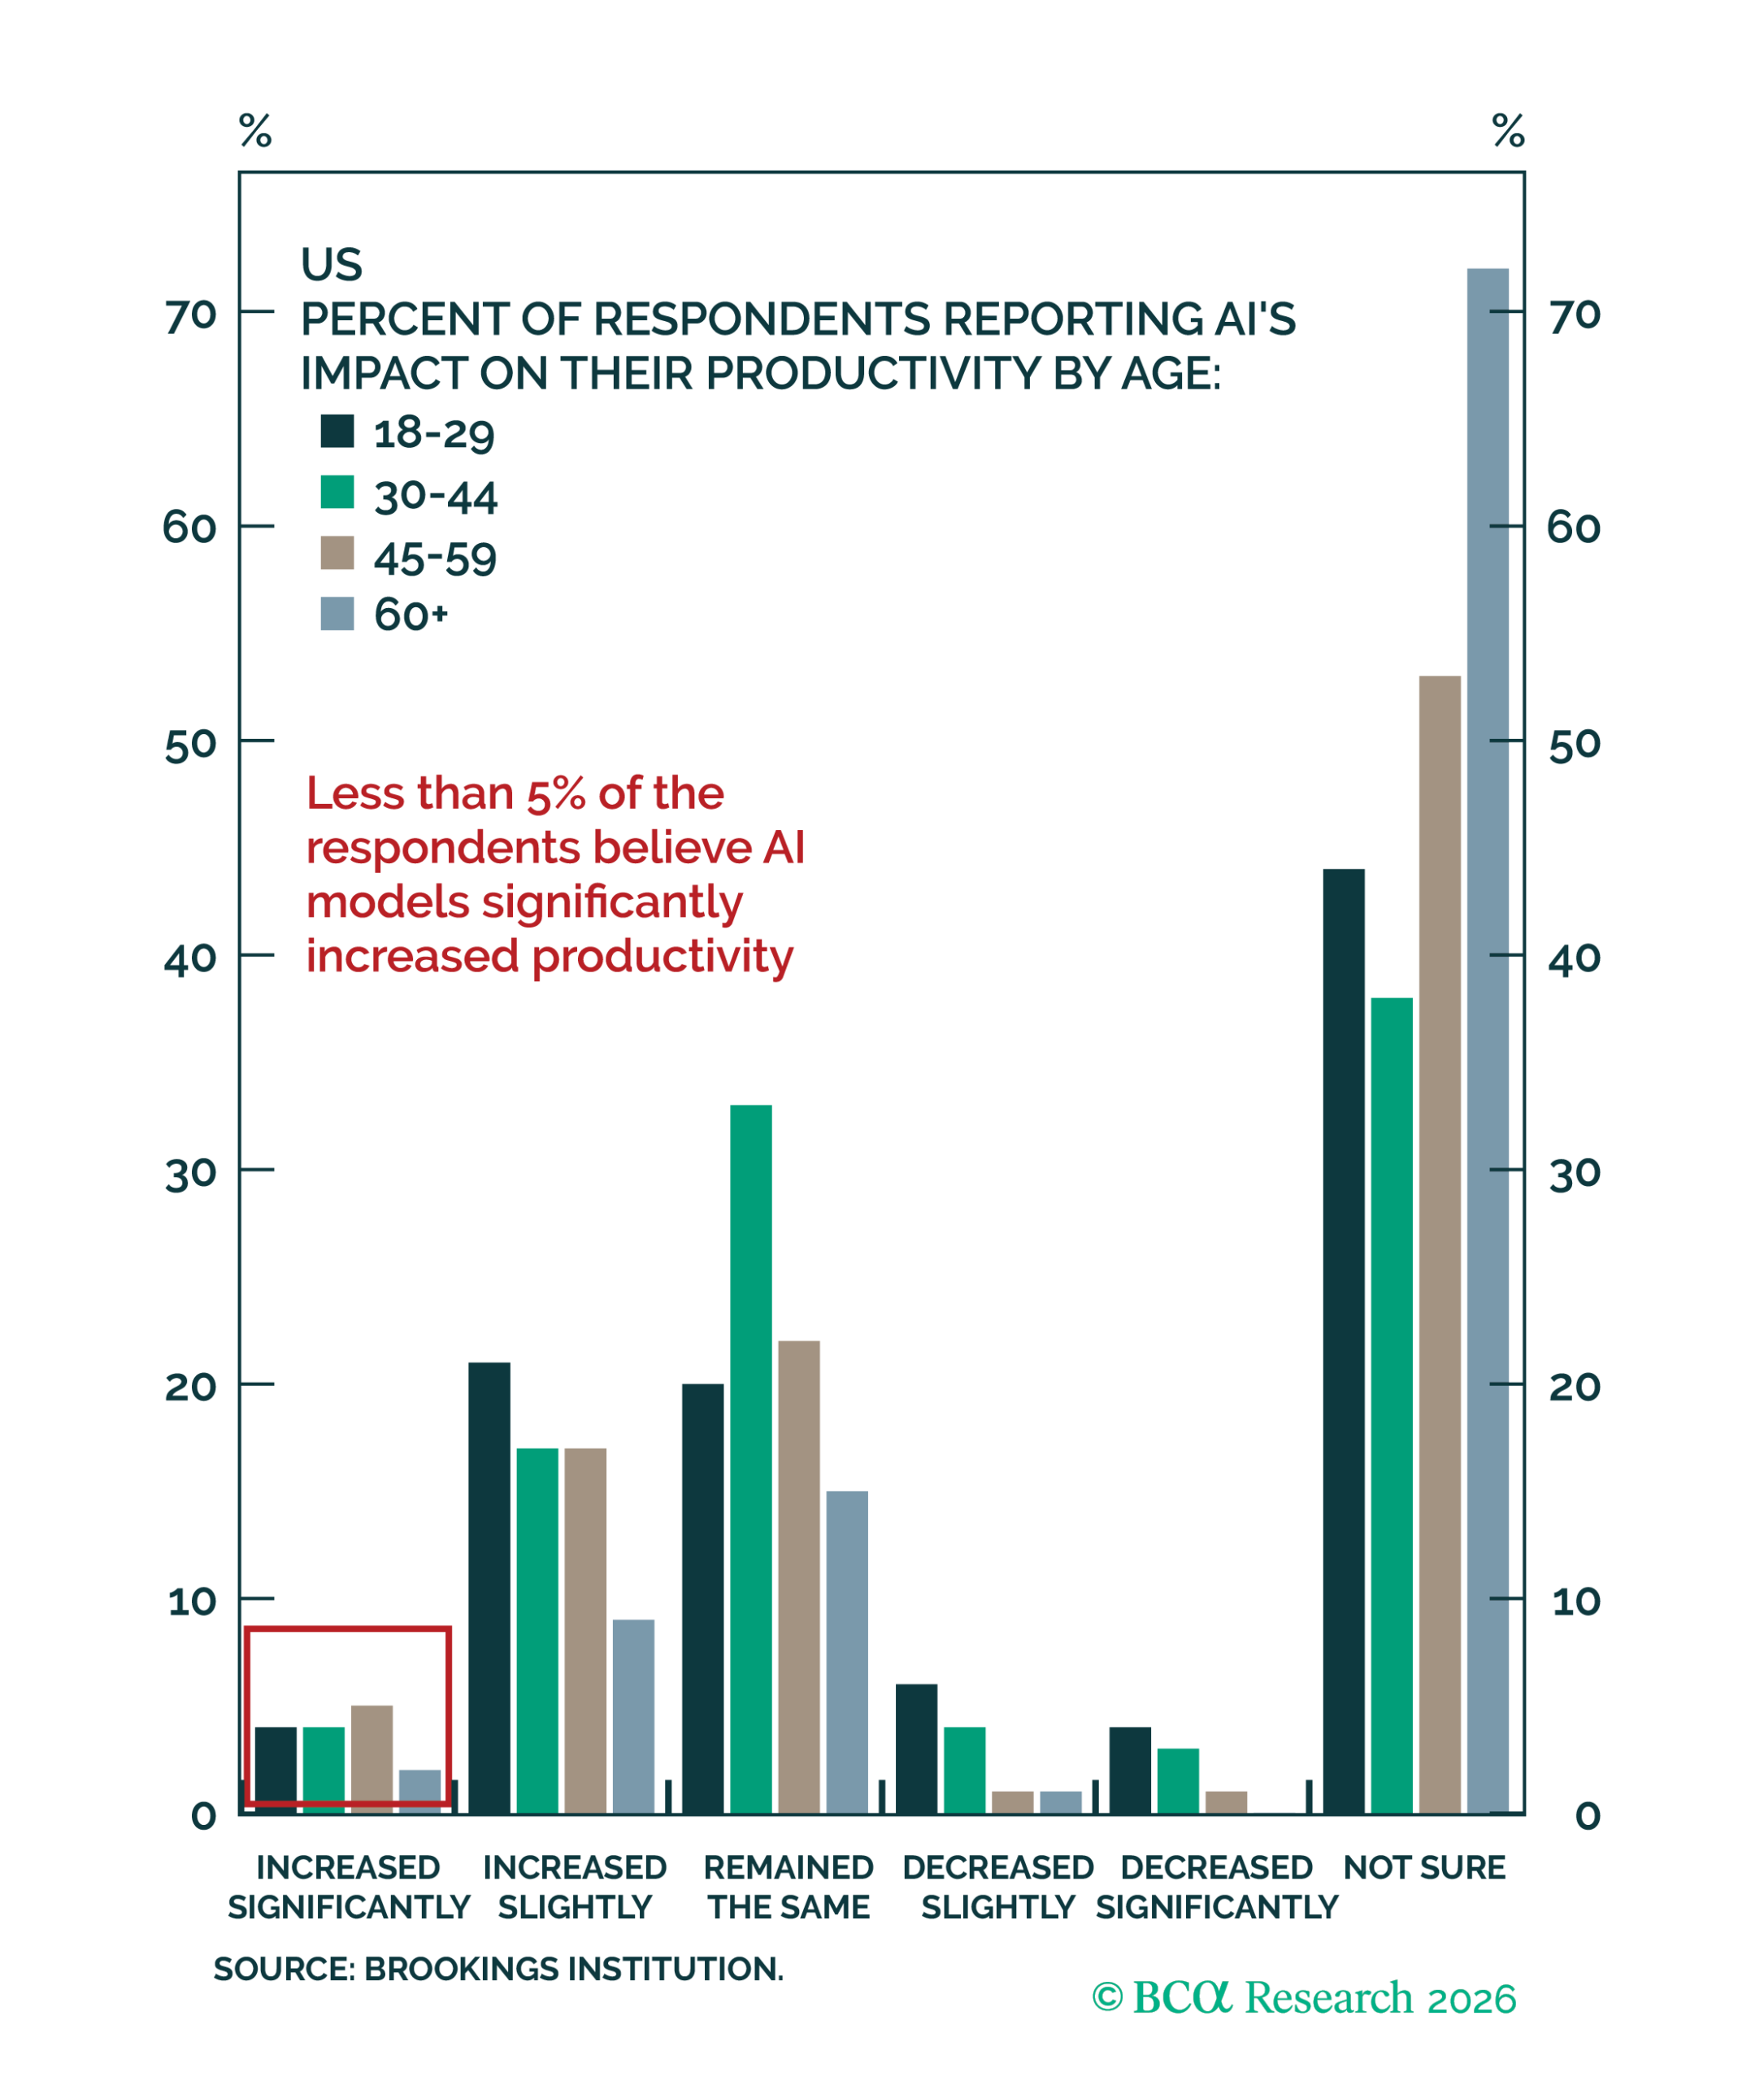
Figure 3 – AI toolsets are not yet providing the productivity gains that the market is pricing in
An economic feedback loop
Viewing today under the same lens of 2001, a two-phase bear market would be driven by an initial AI-sentiment slump in equity markets subsequently feeding back into the real economy through consumer spending, and initiating the broader second phase of an equity market downturn. This link to the influence of the real economy on the equity market can be hypothesised via two main channels.
Channel one: The labour market
The US economy’s year-over-year payroll growth has fallen well below the 1% threshold that has served as a leading indicator of every recession over the past 65 years – see Figure 4. December payroll growth dipped below 0.4%, and given that the recent January print fell below consensus, this downtrend looks to continue.
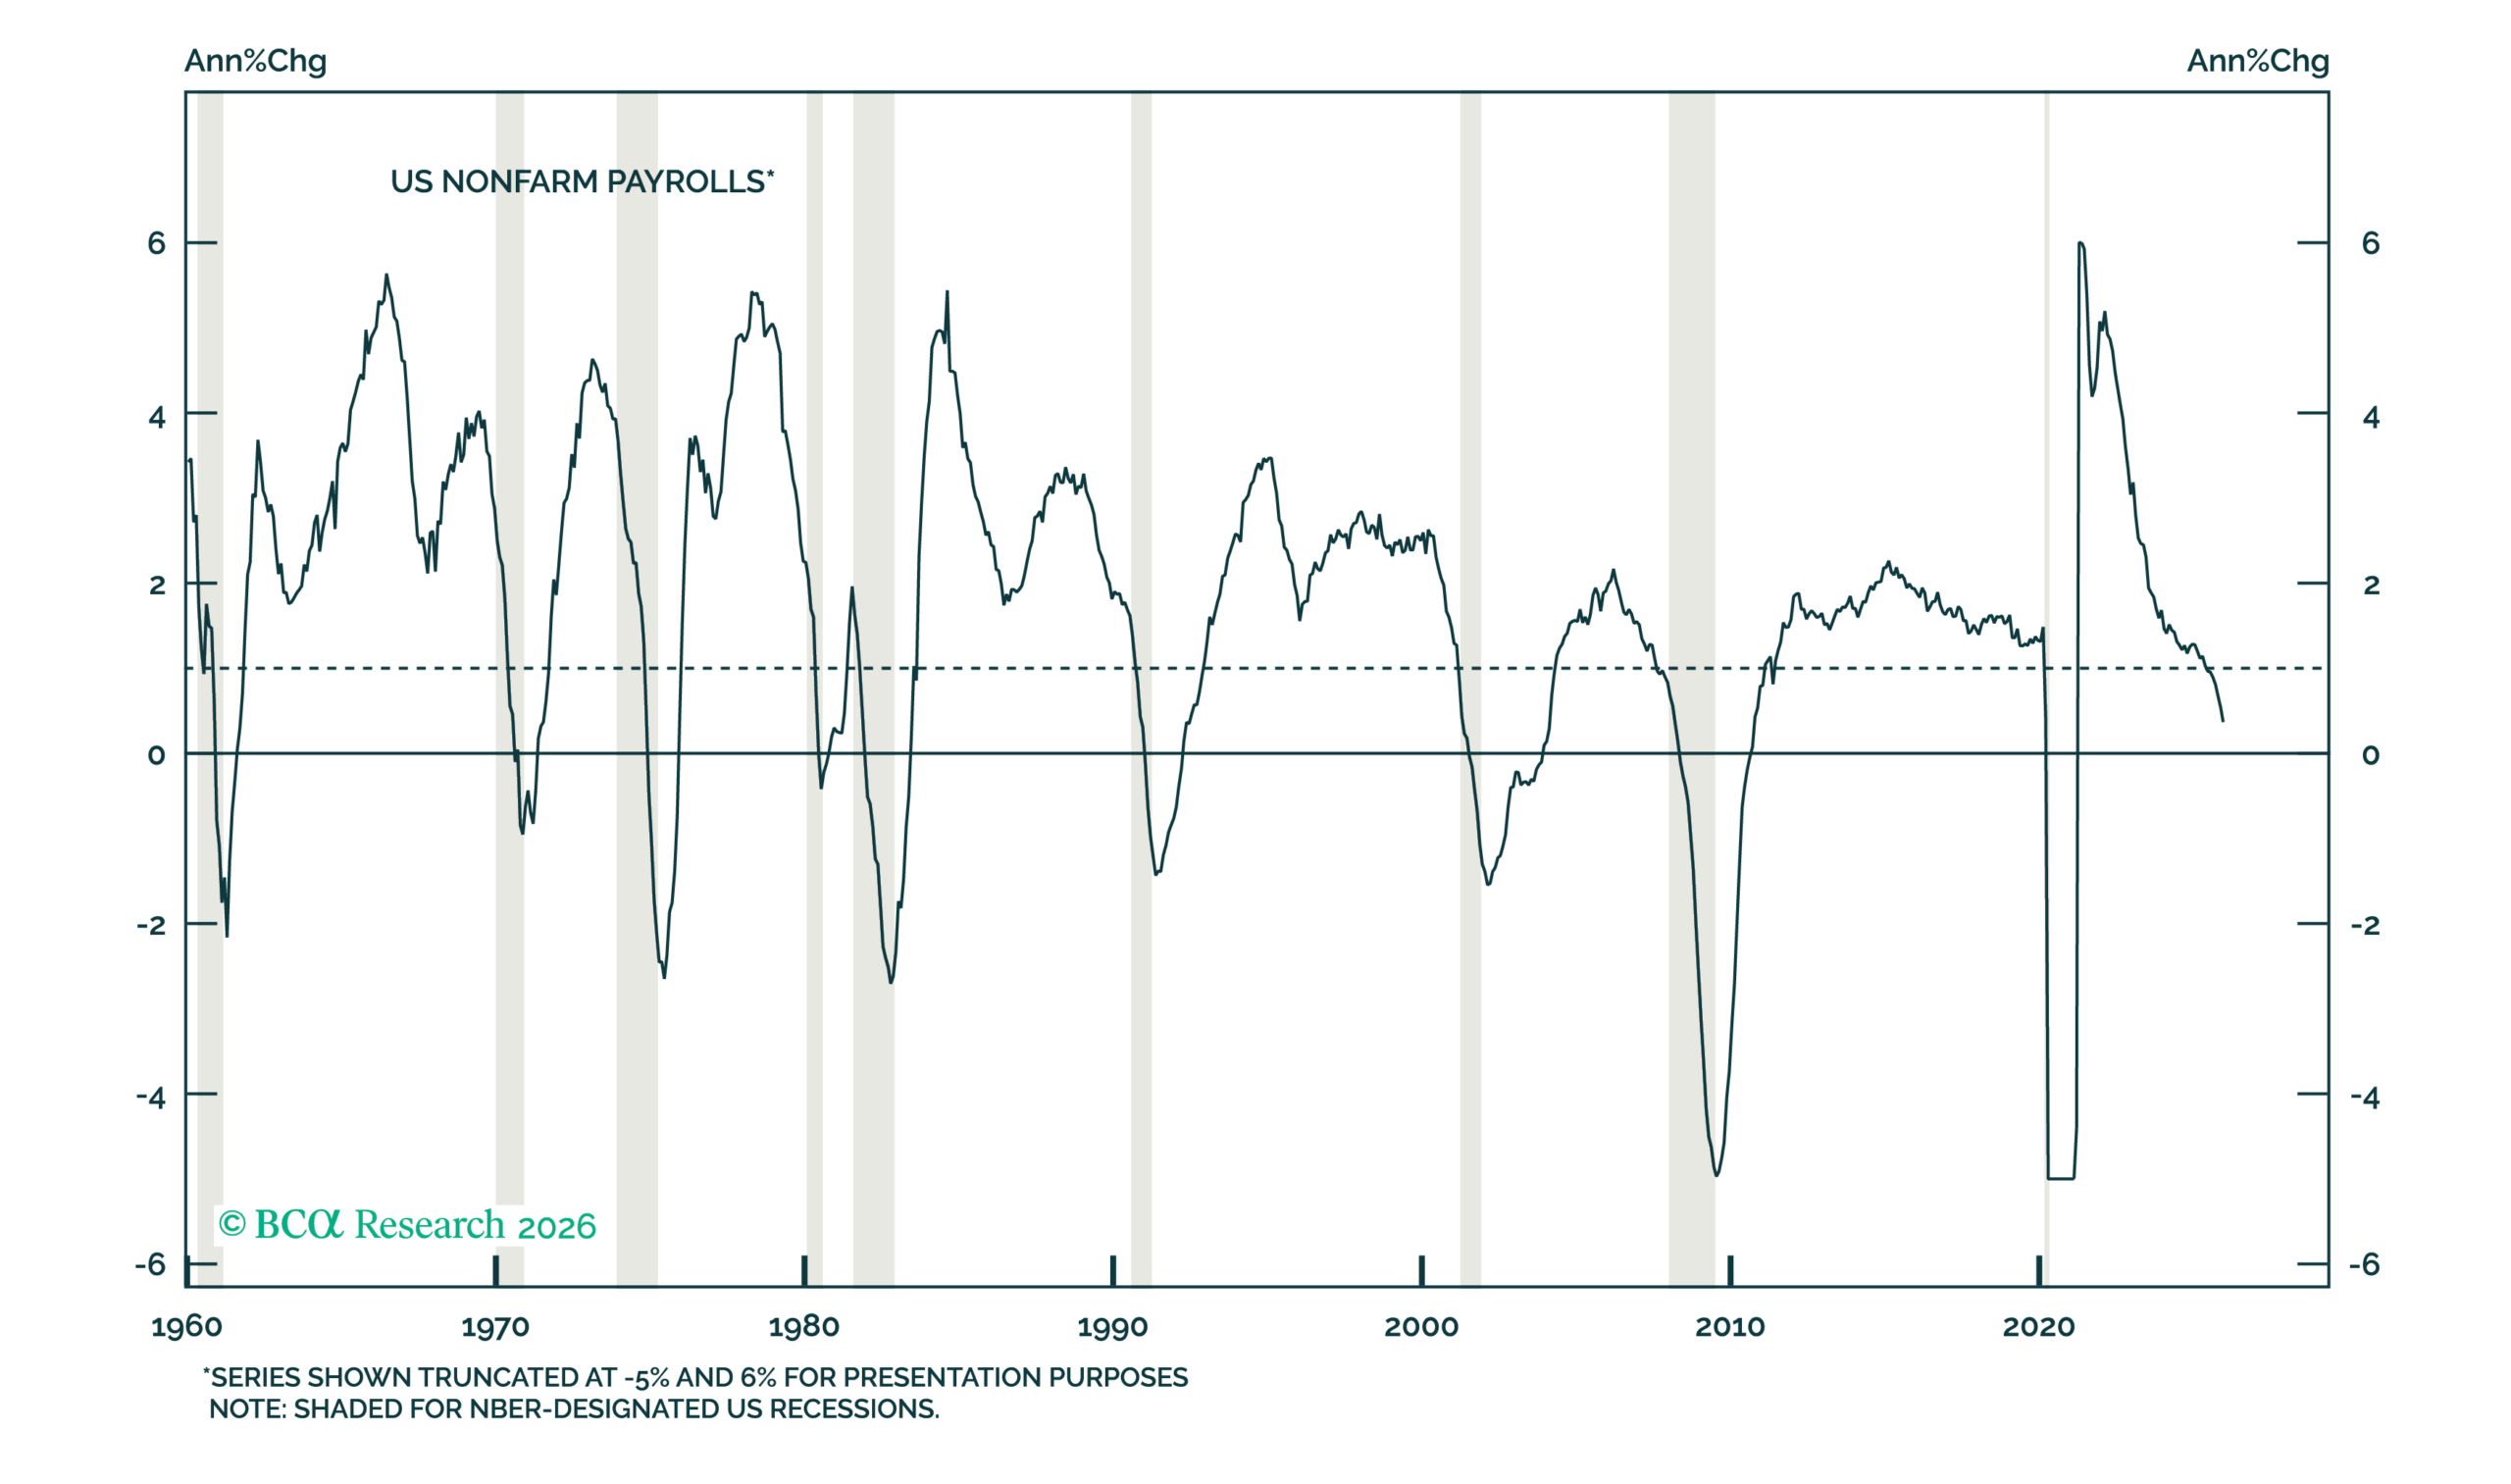
Figure 4 – Payroll growth continues to flash recession warnings
Historical data indicates that there is a strong empirical relationship between payroll (or real income) growth, and consumption. Regression analysis shows that while wealth-effect proxies such as home equity (“net housing wealth”) or S&P 500 appreciation (“equity wealth”) offer explanatory power, real income dynamics are magnitudes above in explaining and predicting consumption trends – see Figure 5. This model of consumption reinforces the view that households’ marginal propensity to consume (“MPC”) is inversely related to their relative wealth. Given consumption’s large share of GDP, this relationship is central to the outlook.

Figure 5 – A regression analysis on explanatory variables for year-over-year consumption growth
This being said, the empirical relationship between payroll and consumption growth has broken recently, diverging from their usual positive relationship. This breakdown poses a challenge in understanding both why, and when, the resilience in consumption will begin to mimic the decline in payroll growth. Logically, the general consumer cannot be assumed to continue spending in perpetuity if their primary sources of income continue to disappear.
One argument for the resilience in consumption is the ability for households to smooth income gaps through borrowing. However, inflation-adjusted credit growth in this cycle has been weaker than most prior postwar expansions. Thus, the more plausible explanation for consumption resilience is at the cost of a drawdown in savings. This tracks the story told by US personal savings rates falling by about 2% from April (the last month of solid payroll growth) to November 2025 – see Figure 6. With the savings rate now near 3.5%, we are entering a period where households are dangerously close to a savings floor where it can no longer be relied on to offset the weakness in income growth and sustain current consumption. Assuming continued pressure on income: strong consumption growth (the primary support for US GDP) will break down.
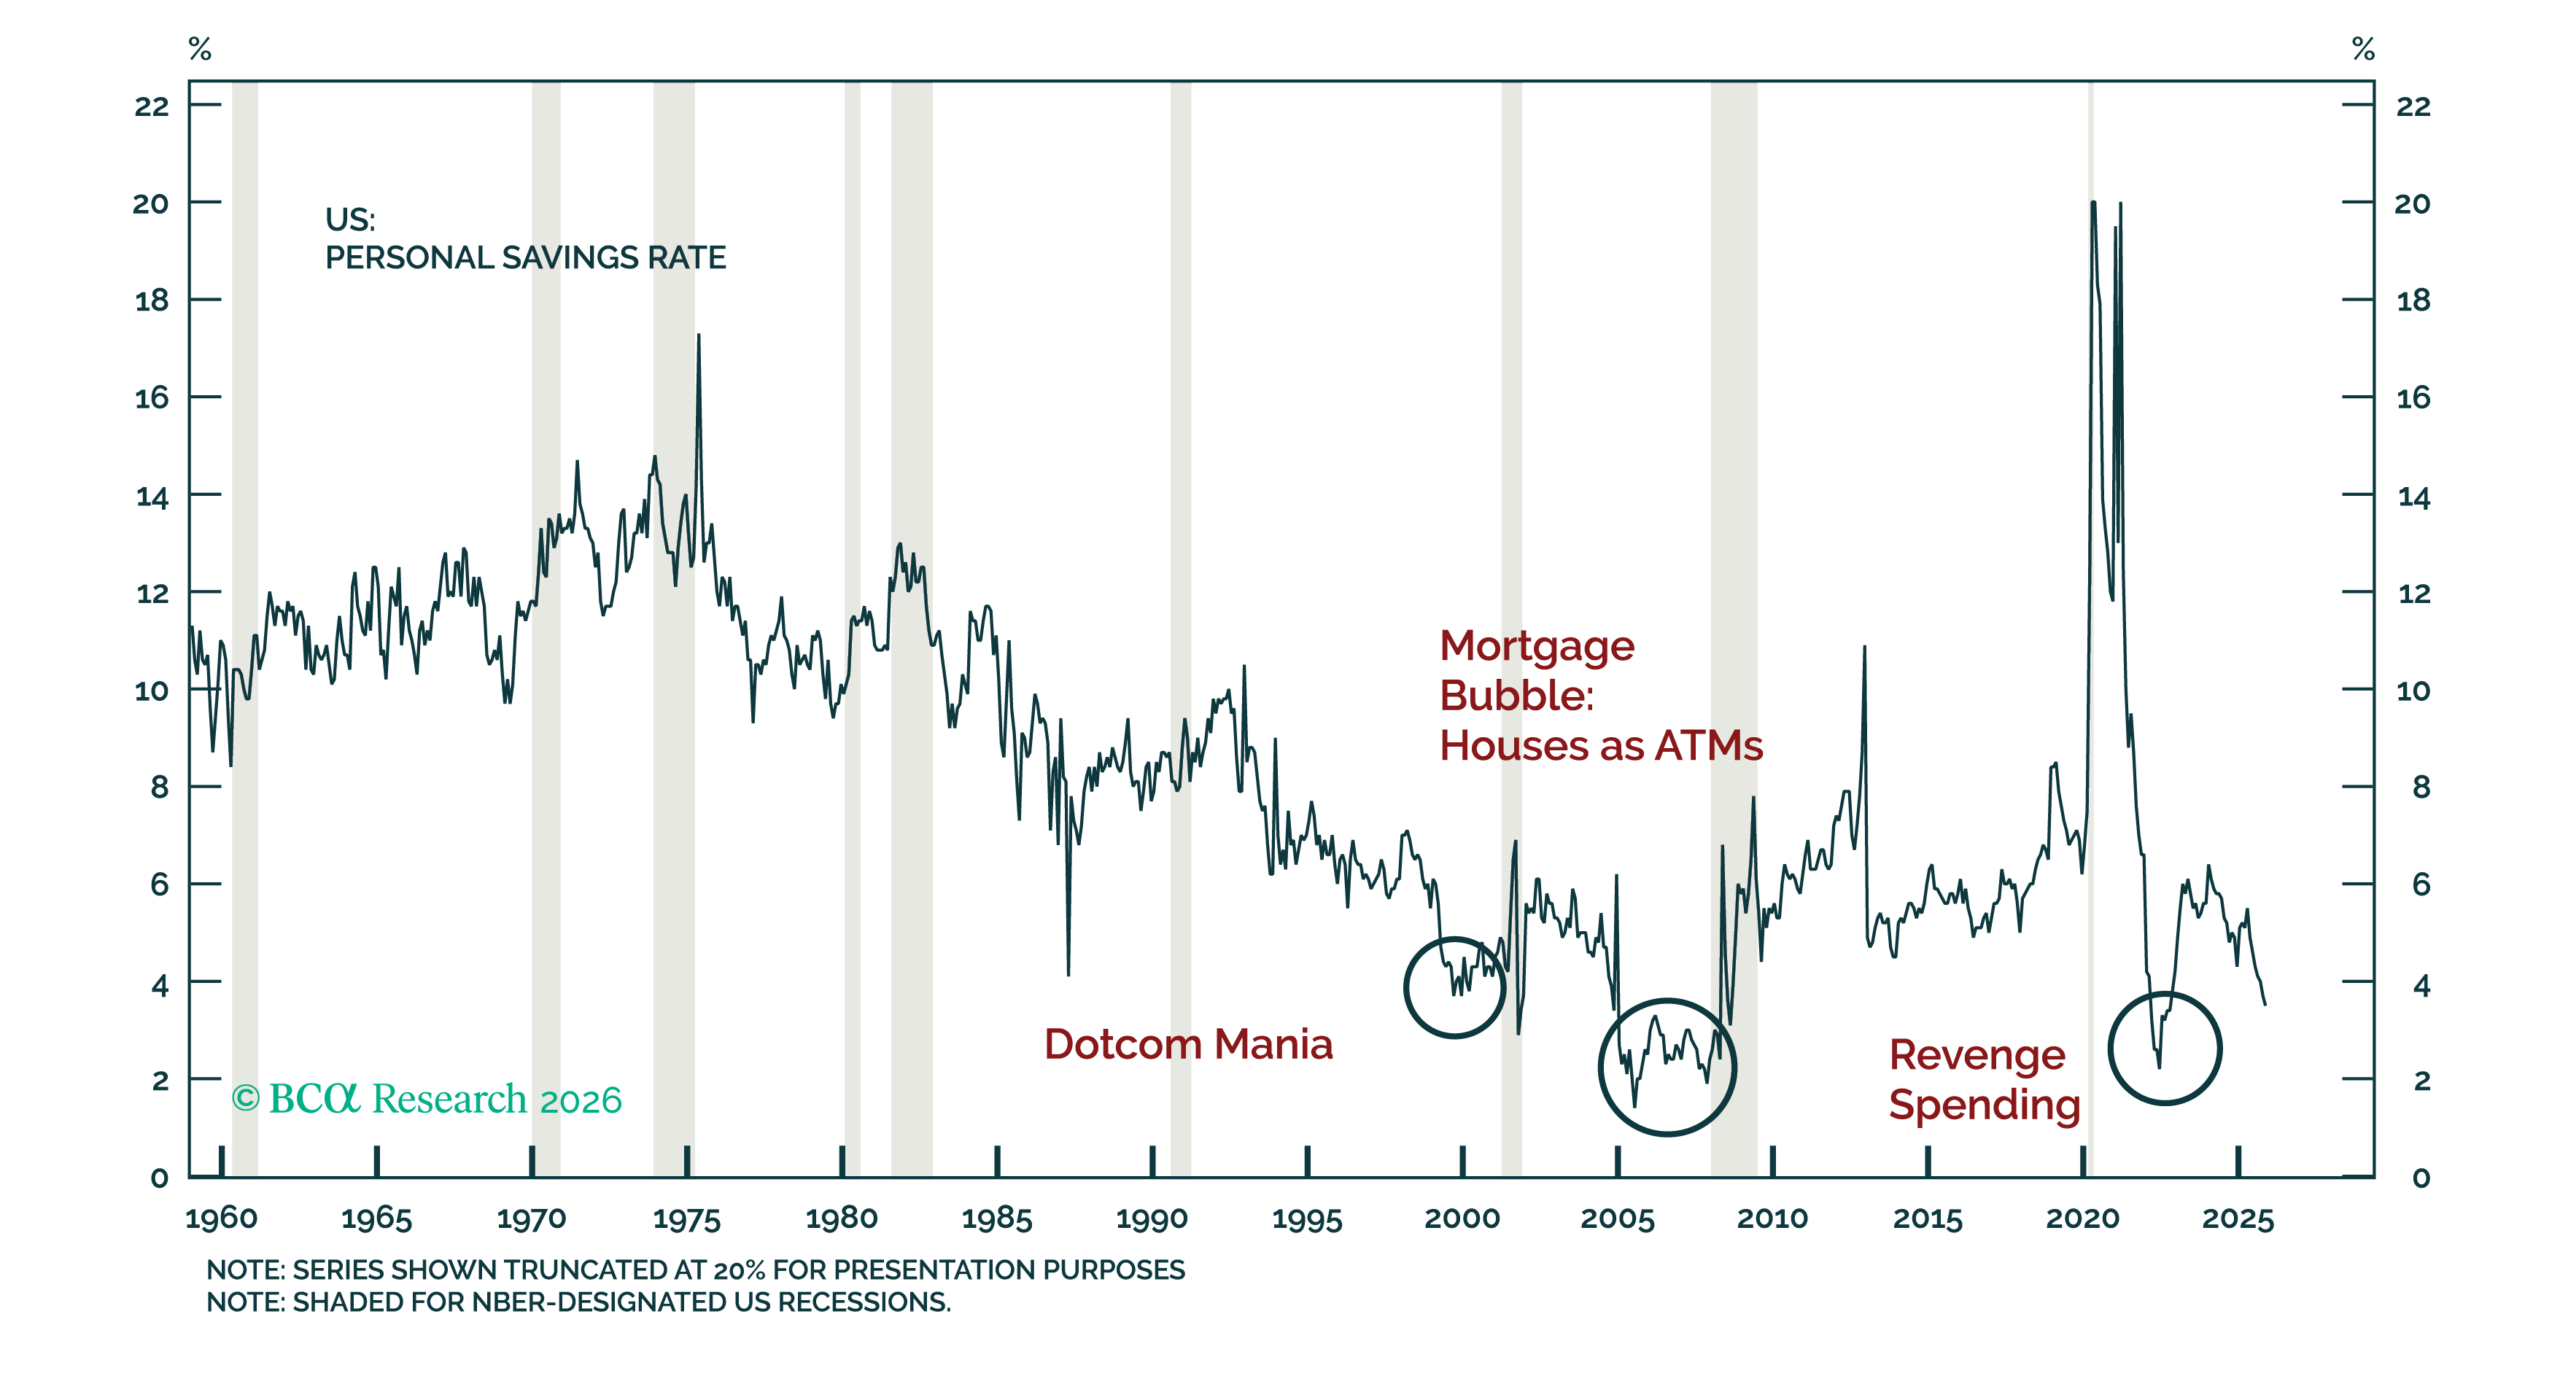
Figure 6 – Saving rates are reaching the left tail of the distribution
Channel two: MPC risk in Middle America
As discussed in our previous newsletter on our 2026 outlook, consumption trends lean heavily on the labour market because middle-income households (which tend to have the highest MPC ratios in an economy) are usually less exposed to equity market wealth effects than affluent households. That being said, it is fair to argue that the US have seen a gradual broadening of equity ownership, as typical US households become more engaged with investing, and the equity market. This has allowed some equity market wealth effects to reach these higher-MPC consumers, helping to support their spending despite sluggish job growth.
Suffice to say, this is a double-edged sword. If rising equity prices have provided an unusually strong tailwind to consumption on the way up, this also implies a stronger headwind during the next drawdown. Empirical evidence suggests that consumption rises by roughly 3 to 5 cents for every additional dollar of equity wealth. With US households holding around $65 trillion in equities at the end of 2025 (Figure 7), a 10% equity market decline would reduce household wealth by about $6.5 trillion, translating into roughly $250 billion in lost consumption demand, or around 0.8% of GDP.
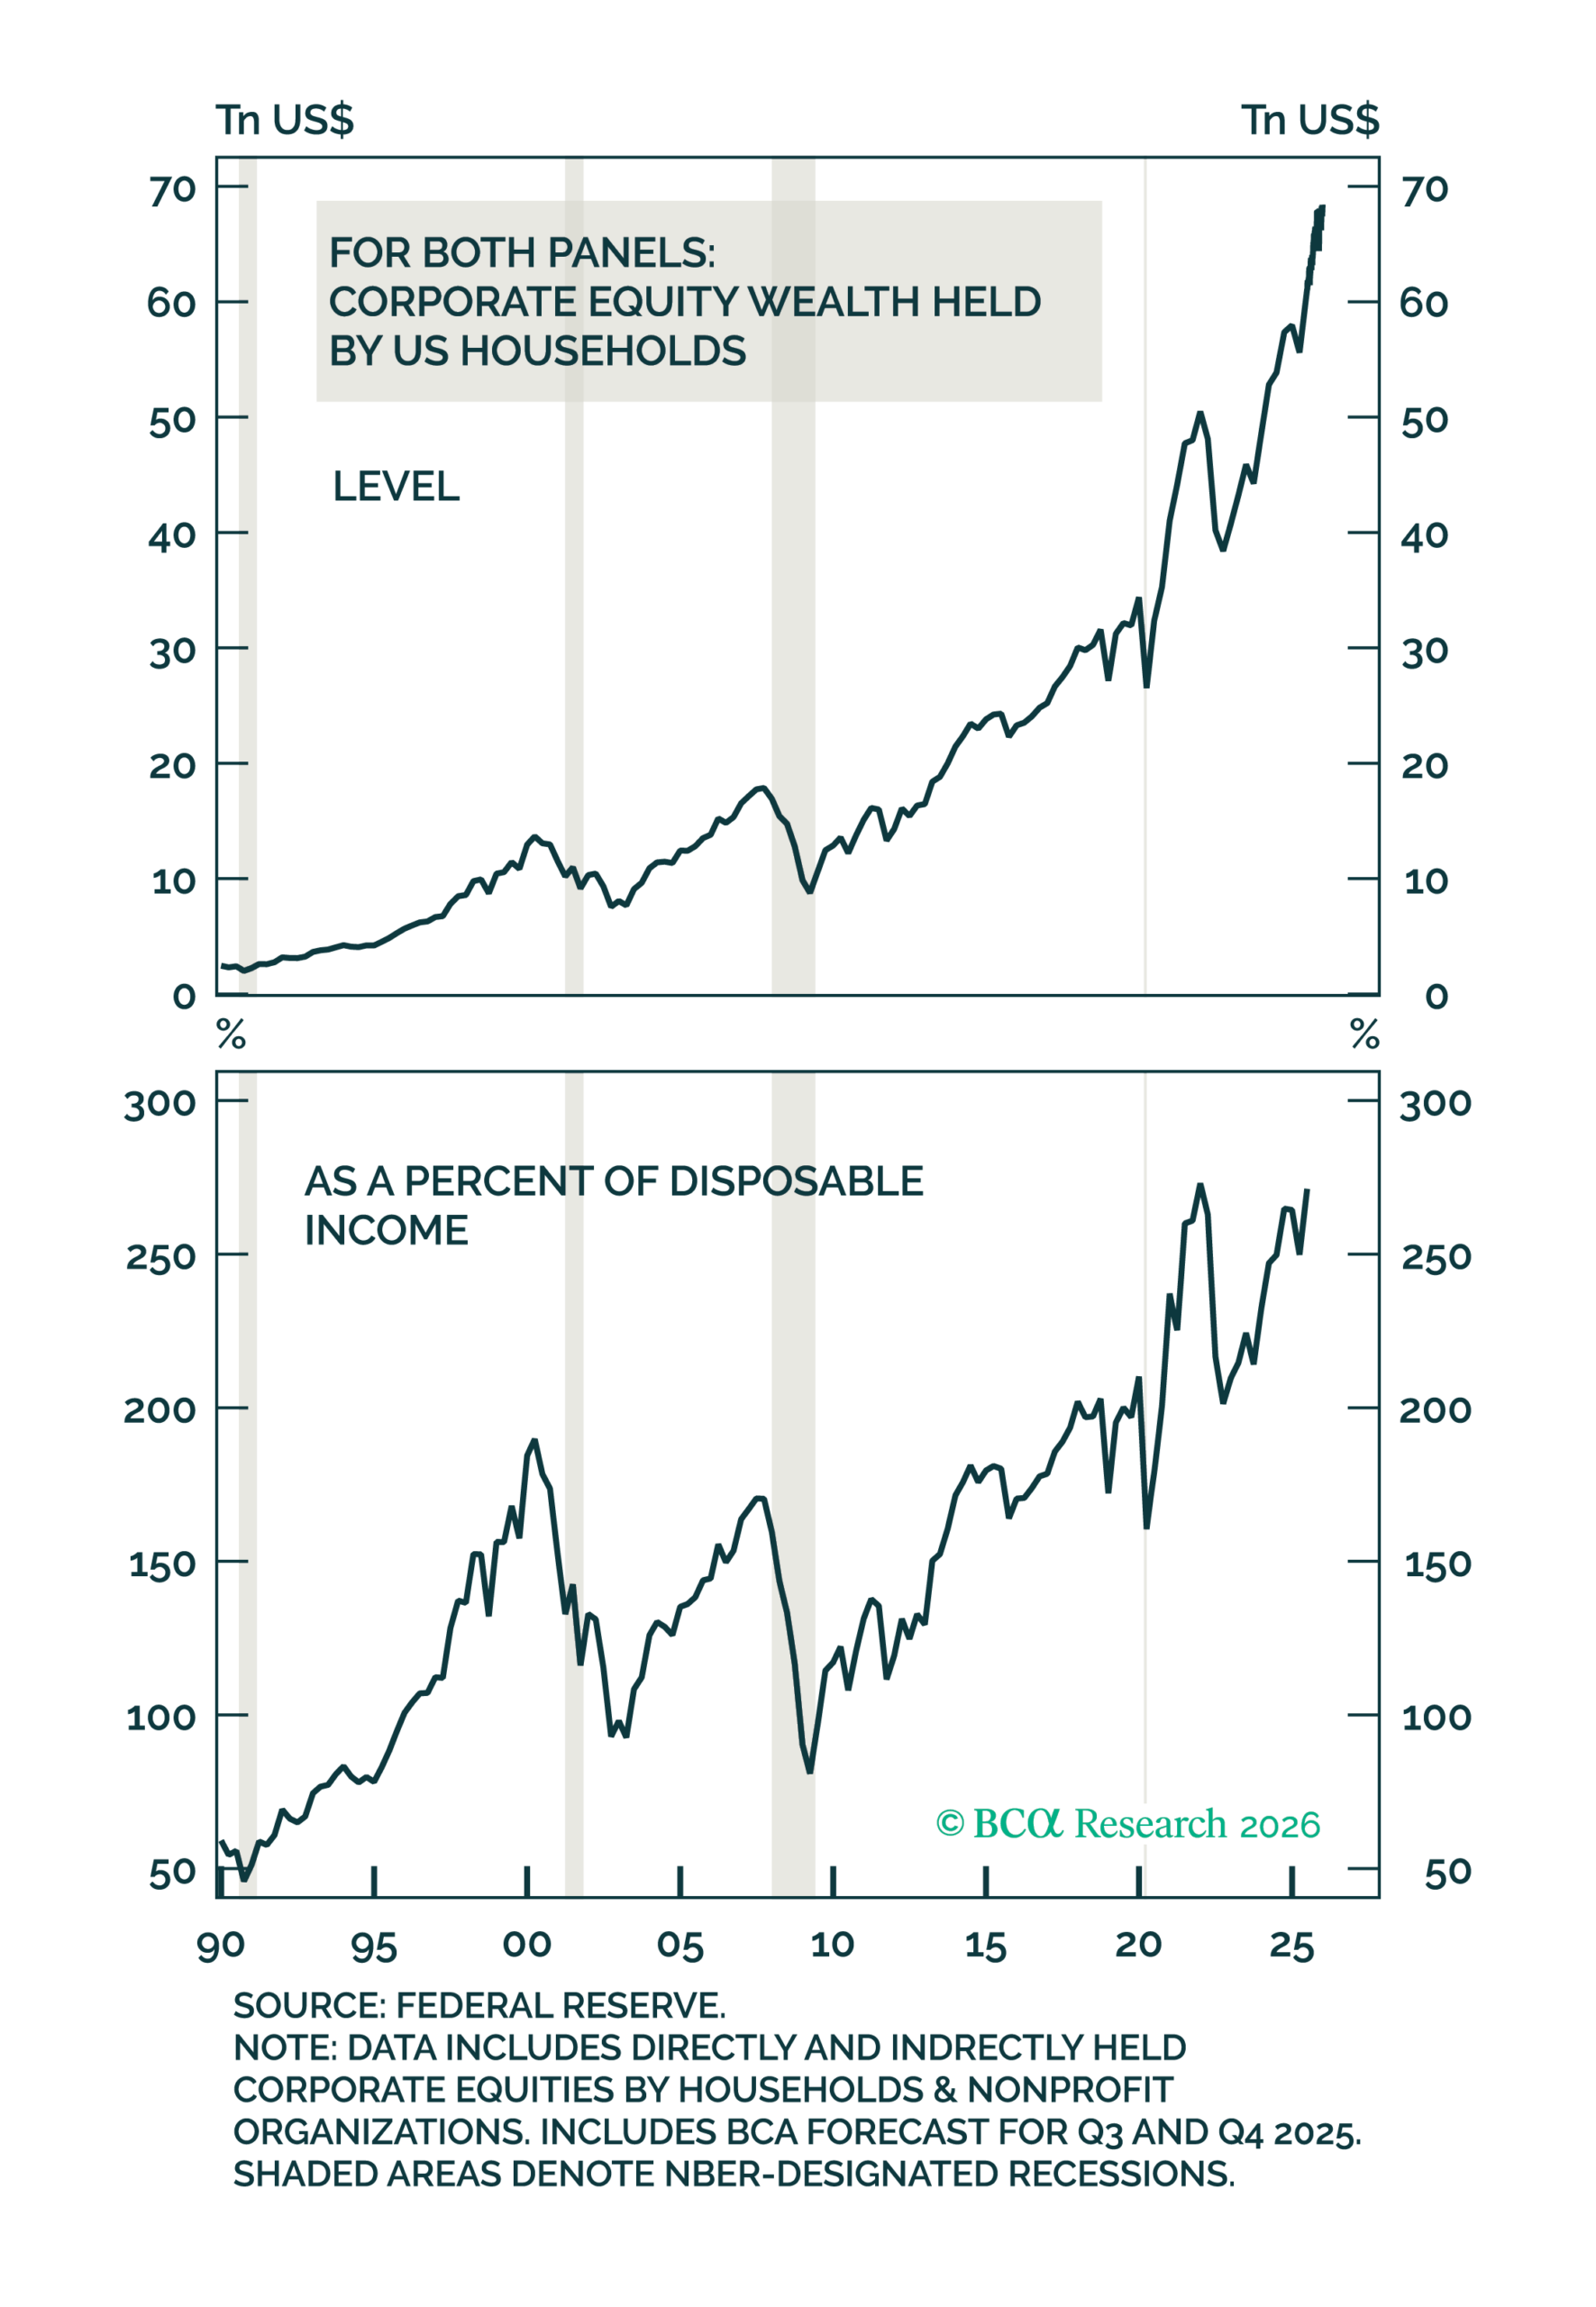
Figure 7 – A strong equity market has lifted overall household wealth
Investment Takeaway
It bears mentioning that the 2001 scenario is just one possible roadmap of what could play out as a consequence of today’s market. However, conducting scenario analysis on a structurally similar historical regime remains a useful exercise, as it cements the outcome in historical precedence. If it happened once, it could happen again in a similar rhyme.
If we model a two-phase bear market, using the two economic channels as inputs, a potential equity market decline could result via the following path:
- Plateauing AI adoption and innovation lead to a revision in sky-high valuations of AI frontier players.
- Phase one of the bear market is entered, in what may look like a broad rotation from tech to non-tech.
- Given the concentration and fervour of broad equity ownership being linked to the AI trade, MPC risk for middle-income households emerges, reversing the wealth effect and dragging consumption.
- This could generate a self-reinforcing feedback loop, as the weaker consumption then feeds into corporate revenues, profitability, and ultimately, further depressed equity valuations in discretionary sectors. As a result, continued pressure in real income growth may be expected.
- With the average consumer’s reliance on their personal savings no longer sufficient to offset real income declines: Consumption could completely reverse, with recession fears leading to a broad equity market decline.
If you are interested in finding out more about how cognisance of the macroeconomic backdrop impacts our investment decision making process, connect with Integrity Asset Management and let us help you navigate your investing journey.
For more information on this synopsis or to discuss solutions provided by Integrity Asset Management, please contact us at:
Tel: (021) 671 2112
Cell: 072 513 2684 / 084 601 1025
E-mail: nic@integrityam.co.za / herman@integrityam.co.za
Source: Bloomberg, 30 January 2026