
Entering 2026, we outline our base case outlook for the US equity market and broad economy:
The Equity Market: The AI trade in 2026
First referencing the prior regime shift in technology, the winners of the internet era were asset-light, primarily benefiting from network effects. Effectively, the business model of these companies created natural monopolies without any need for large physical investments in infrastructure and generated substantial returns on invested capital as a result – see Figure 1.
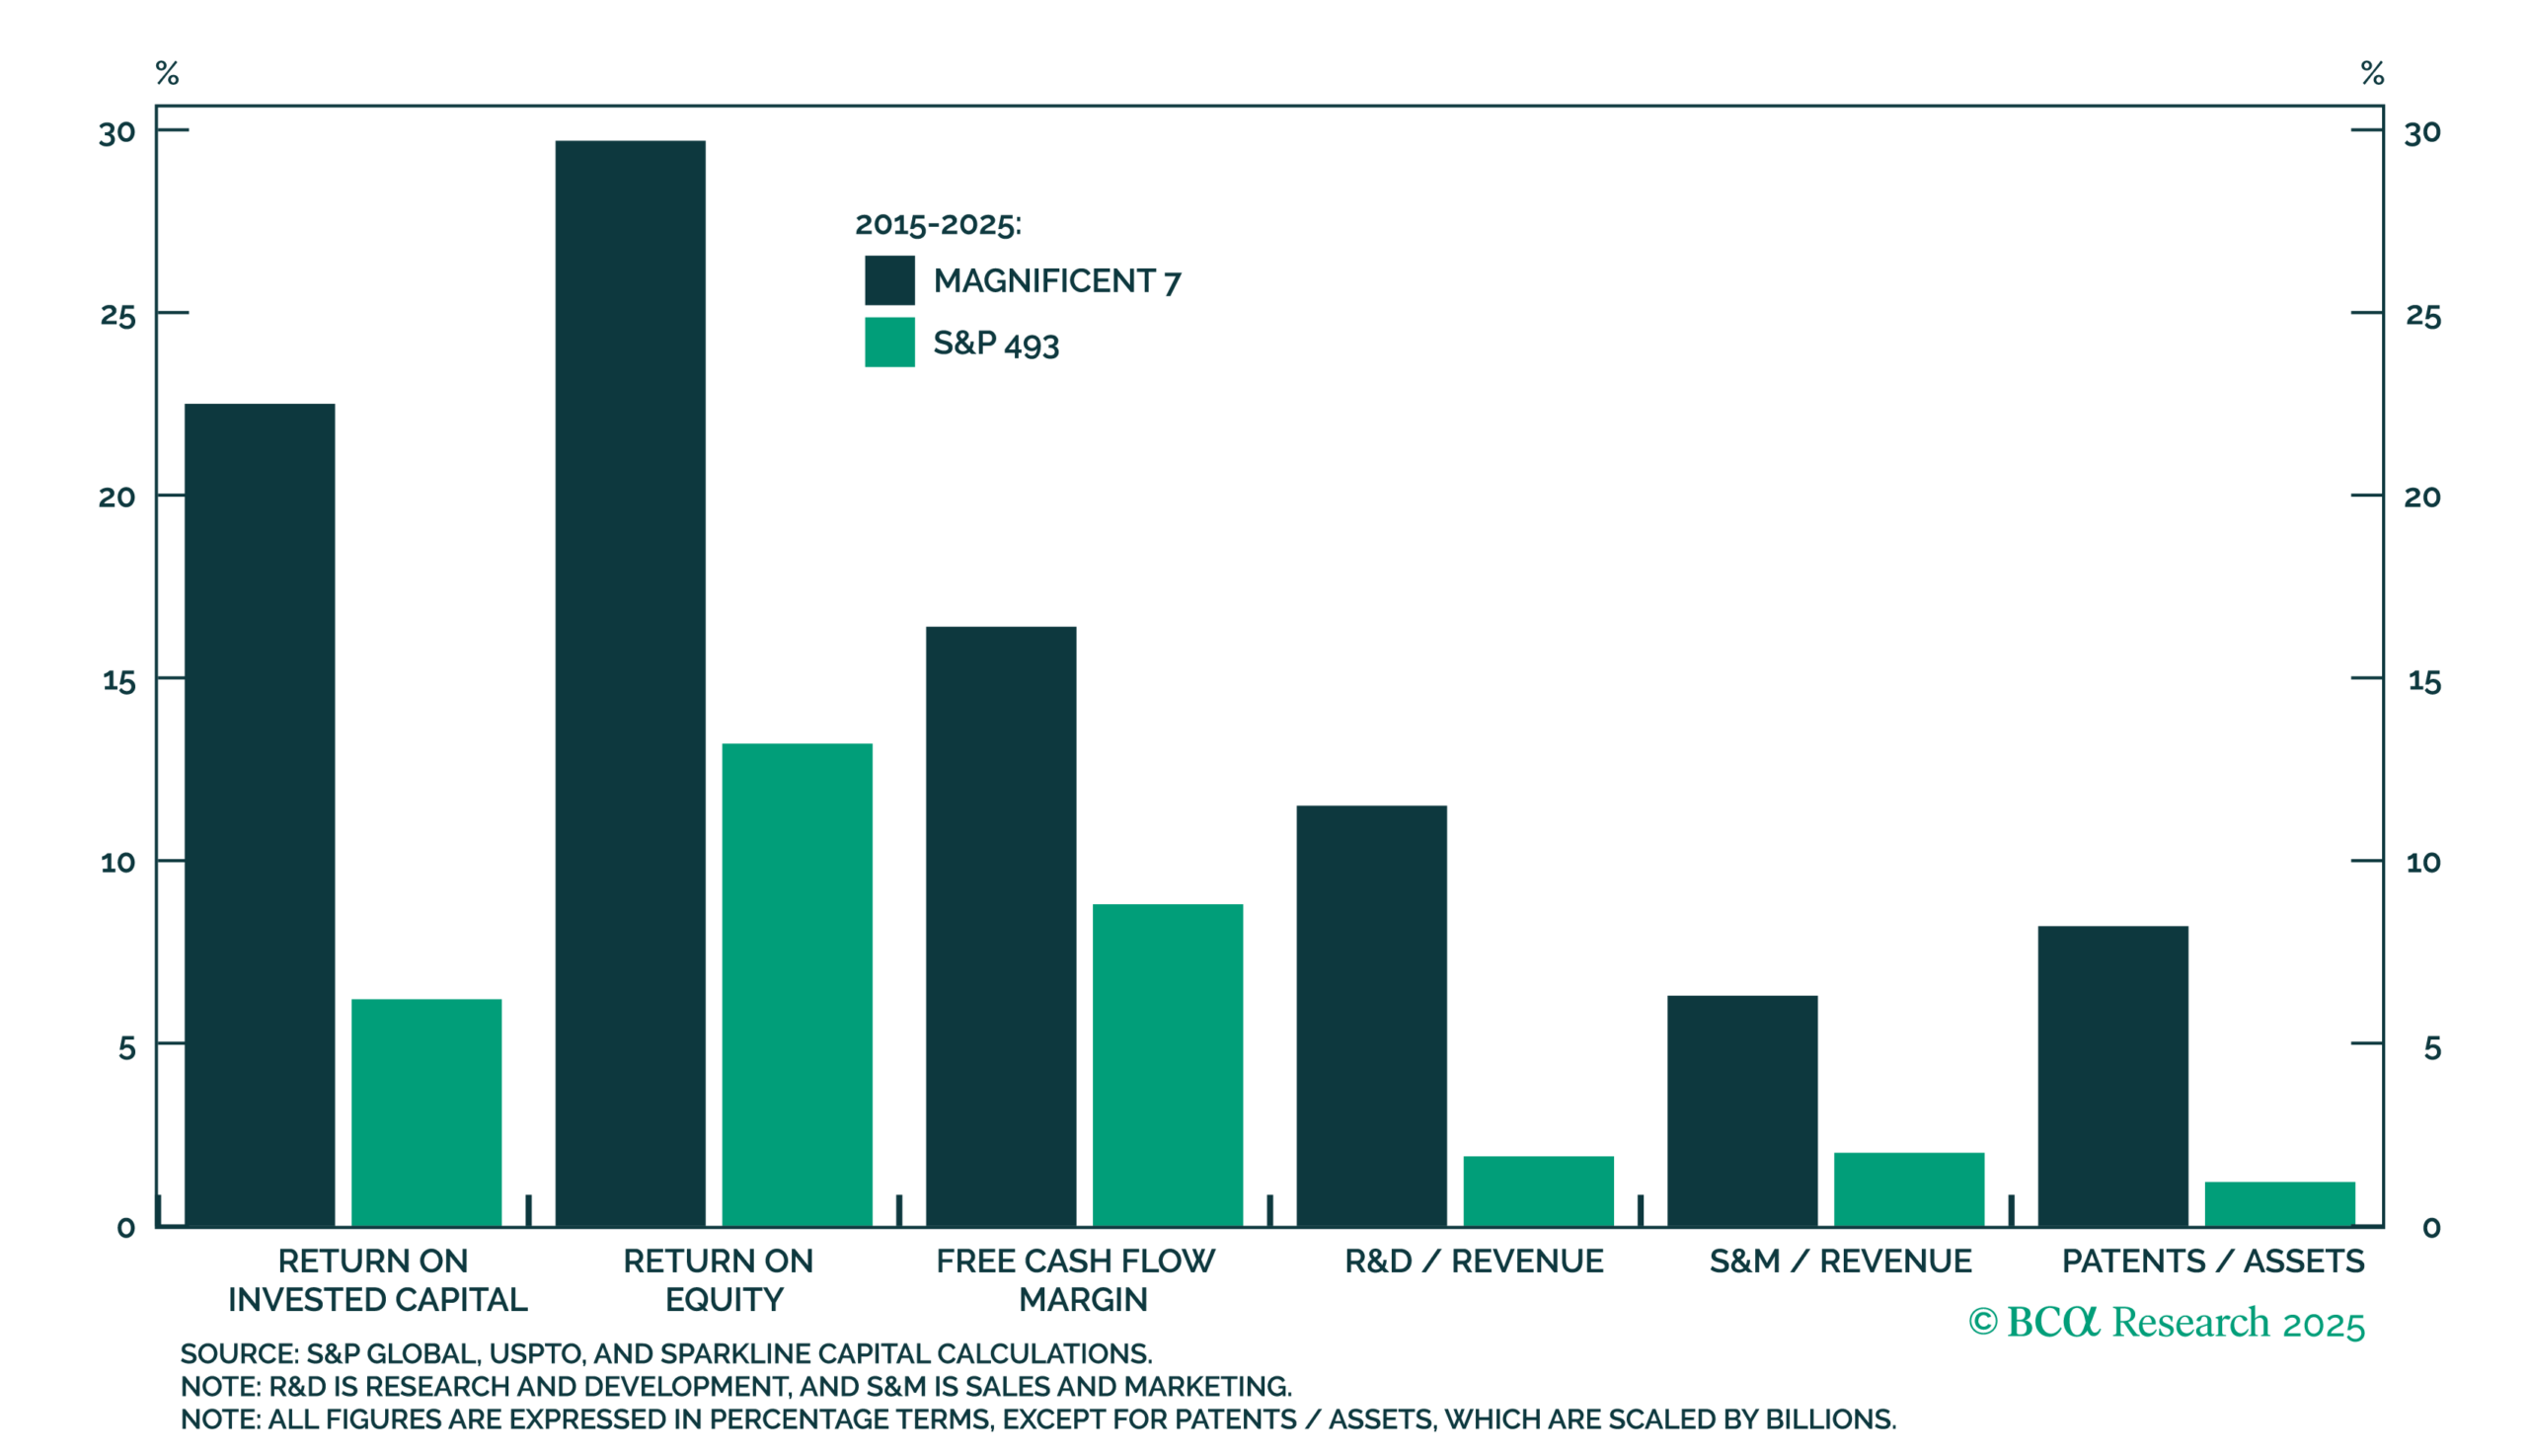
Figure 1 – The reliance on intangible assets and R&D embodied the business model of internet-age companies
By contrast, the AI regime has forced hyperscalers toward more asset-intensive business models that will depend on physical economies of scale, rather than network effects. Operating and expanding data centre infrastructure, along with ongoing chip replacement cycles, require continuous and large-scale capital expenditure (“capex”). This could naturally begin to weigh on margins and returns on invested capital, especially if the cost of innovation starts to see diminishing returns. The cost of simply maintaining operations will be structurally high, similar to what one sees in the telecom industry.
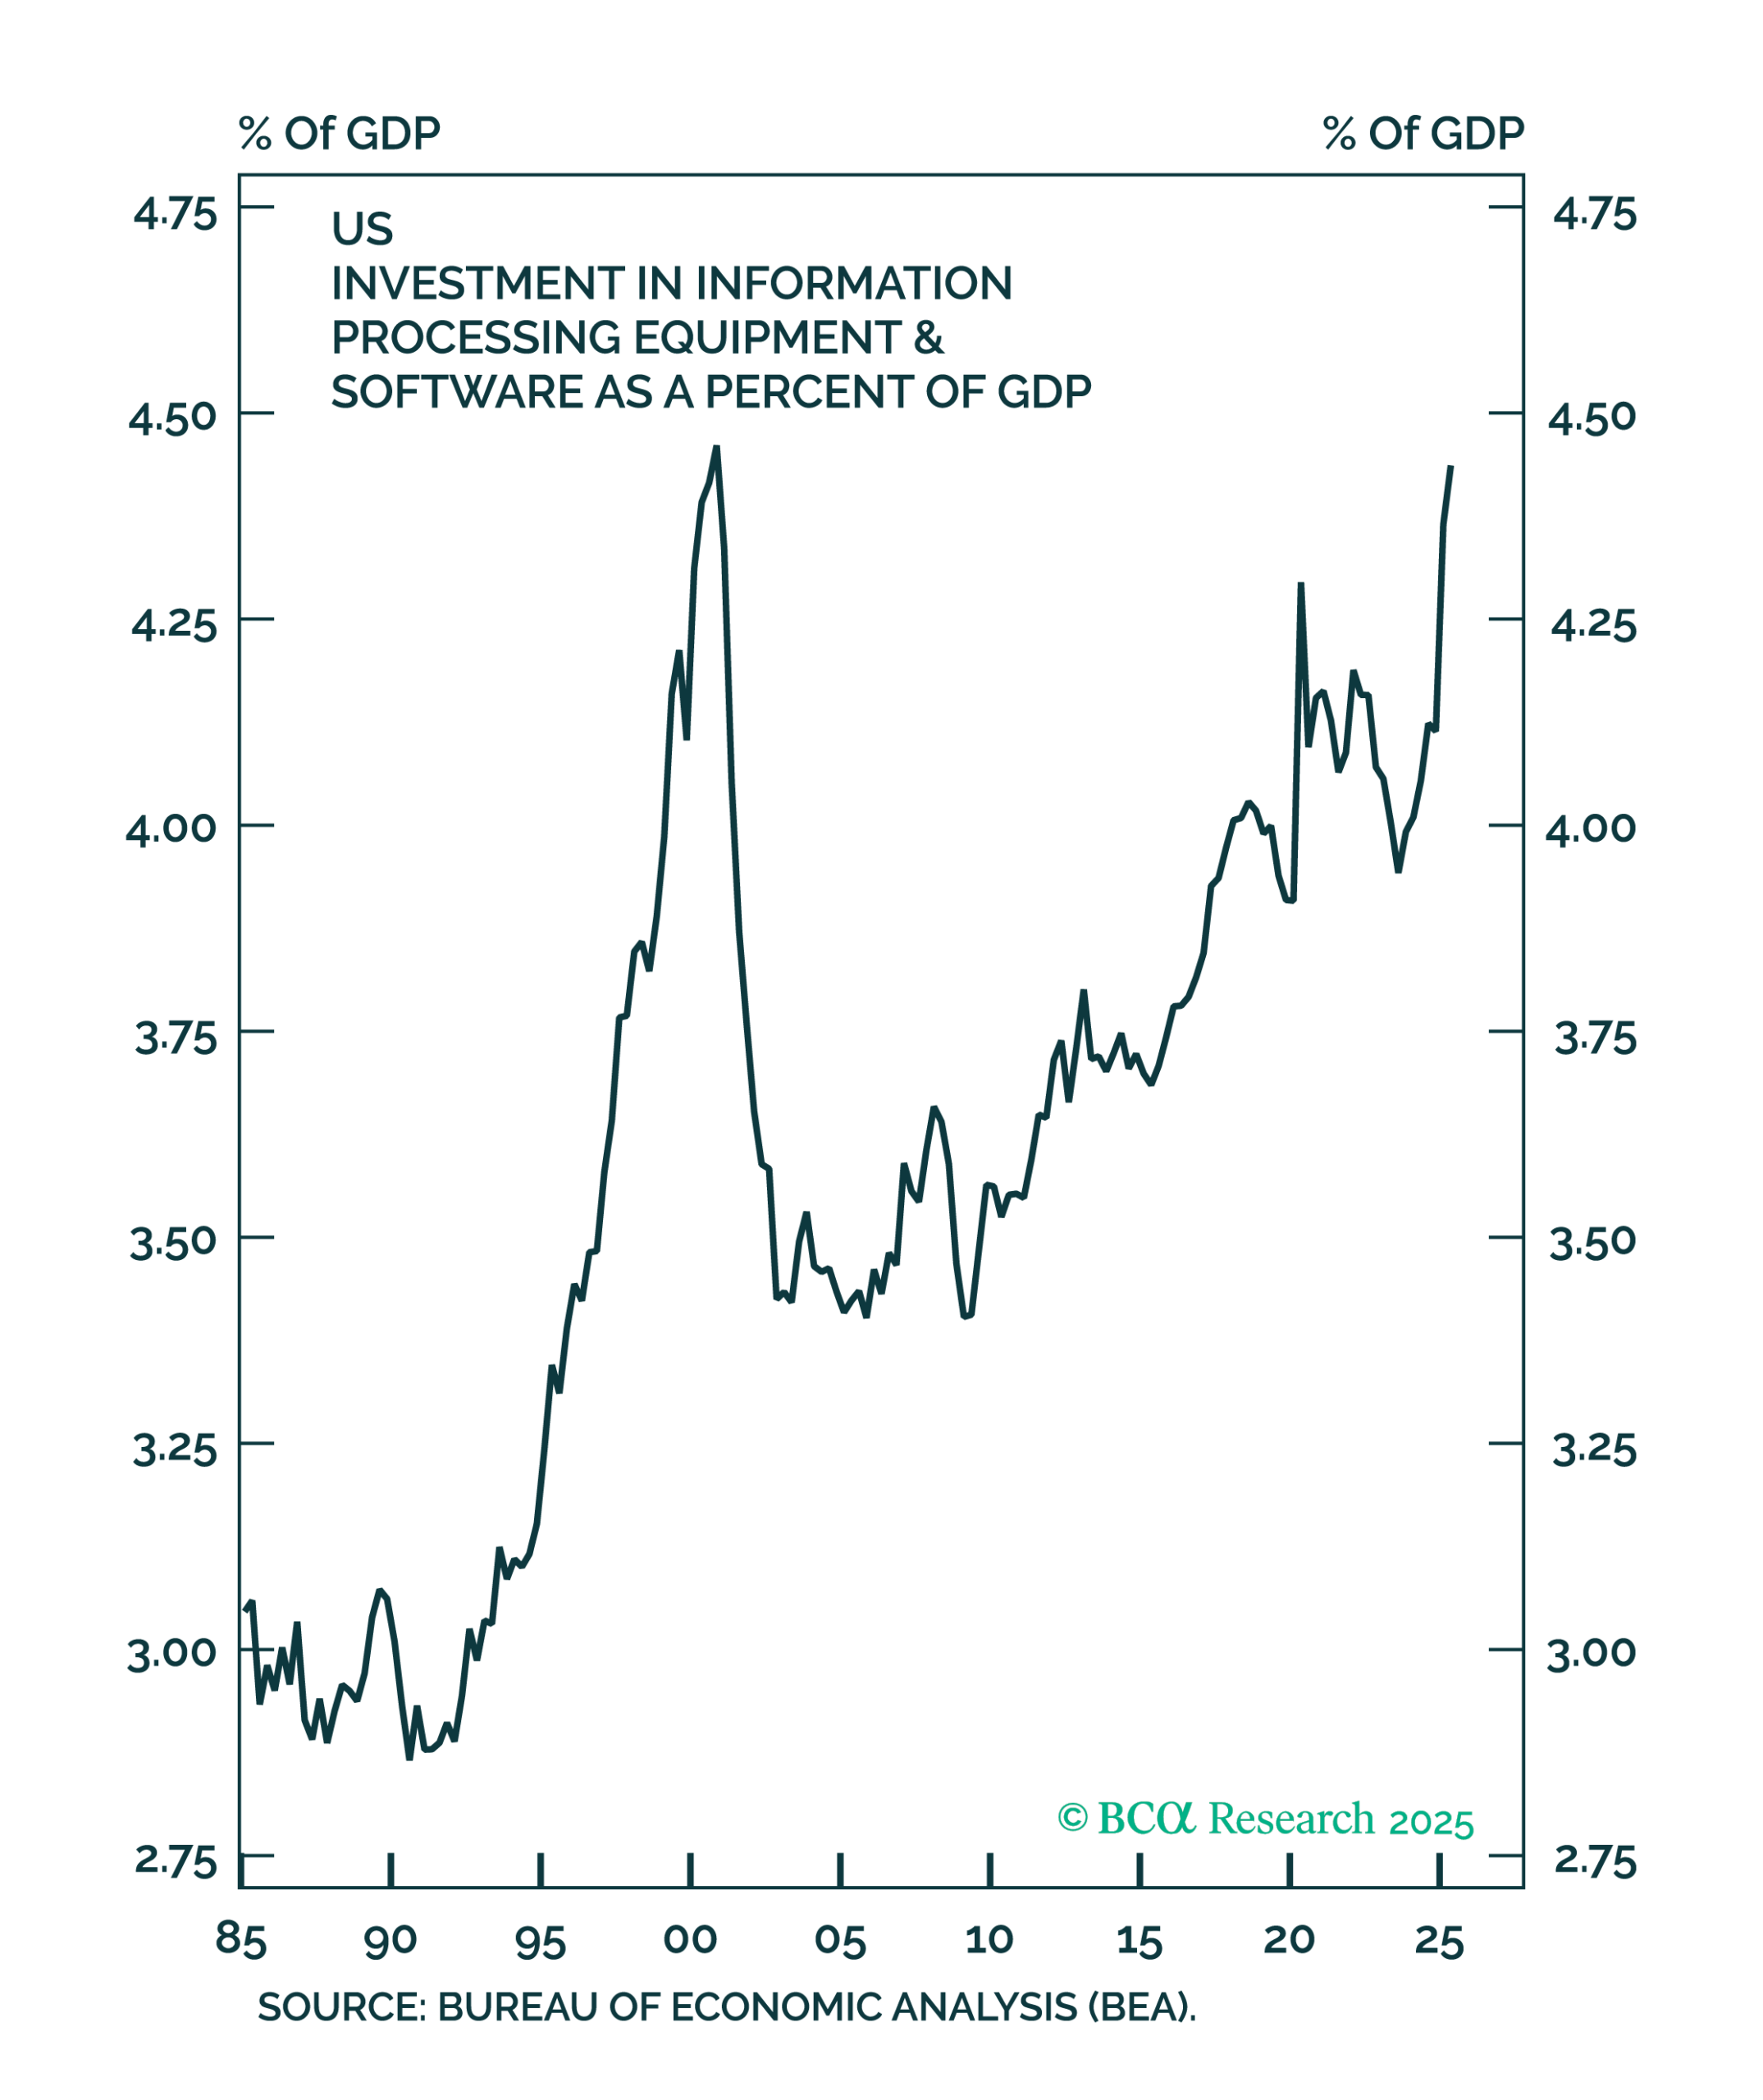
Figure 2 – Tech investment back to dotcom boom levels
During 2025, investment in tech equipment and software reached 4.4% of GDP, nearly matching the dotcom-era peak – see Figure 2. The five major hyperscalers (Amazon, Google, Meta, Microsoft, and Oracle) have collectively guided their plan to add around $2 trillion of AI-related assets onto their respective balance sheets by 2030. Additionally, OpenAI expects to invest roughly $1.4 trillion in data centres, alongside the billions in further commitments earmarked by 1) other AI monetisers, and 2) the emerging “neoclouds” industry (e.g. CoreWeave, Nebius, and IREN).
With AI assets depreciating at an estimated rate of 20% annually, hyperscalers would face an implied depreciation expense of roughly $400 billion per year on these commitments. This is more than the total profits they generated in 2025.
An additional near-term challenge that becomes apparent for this regime, is financing.
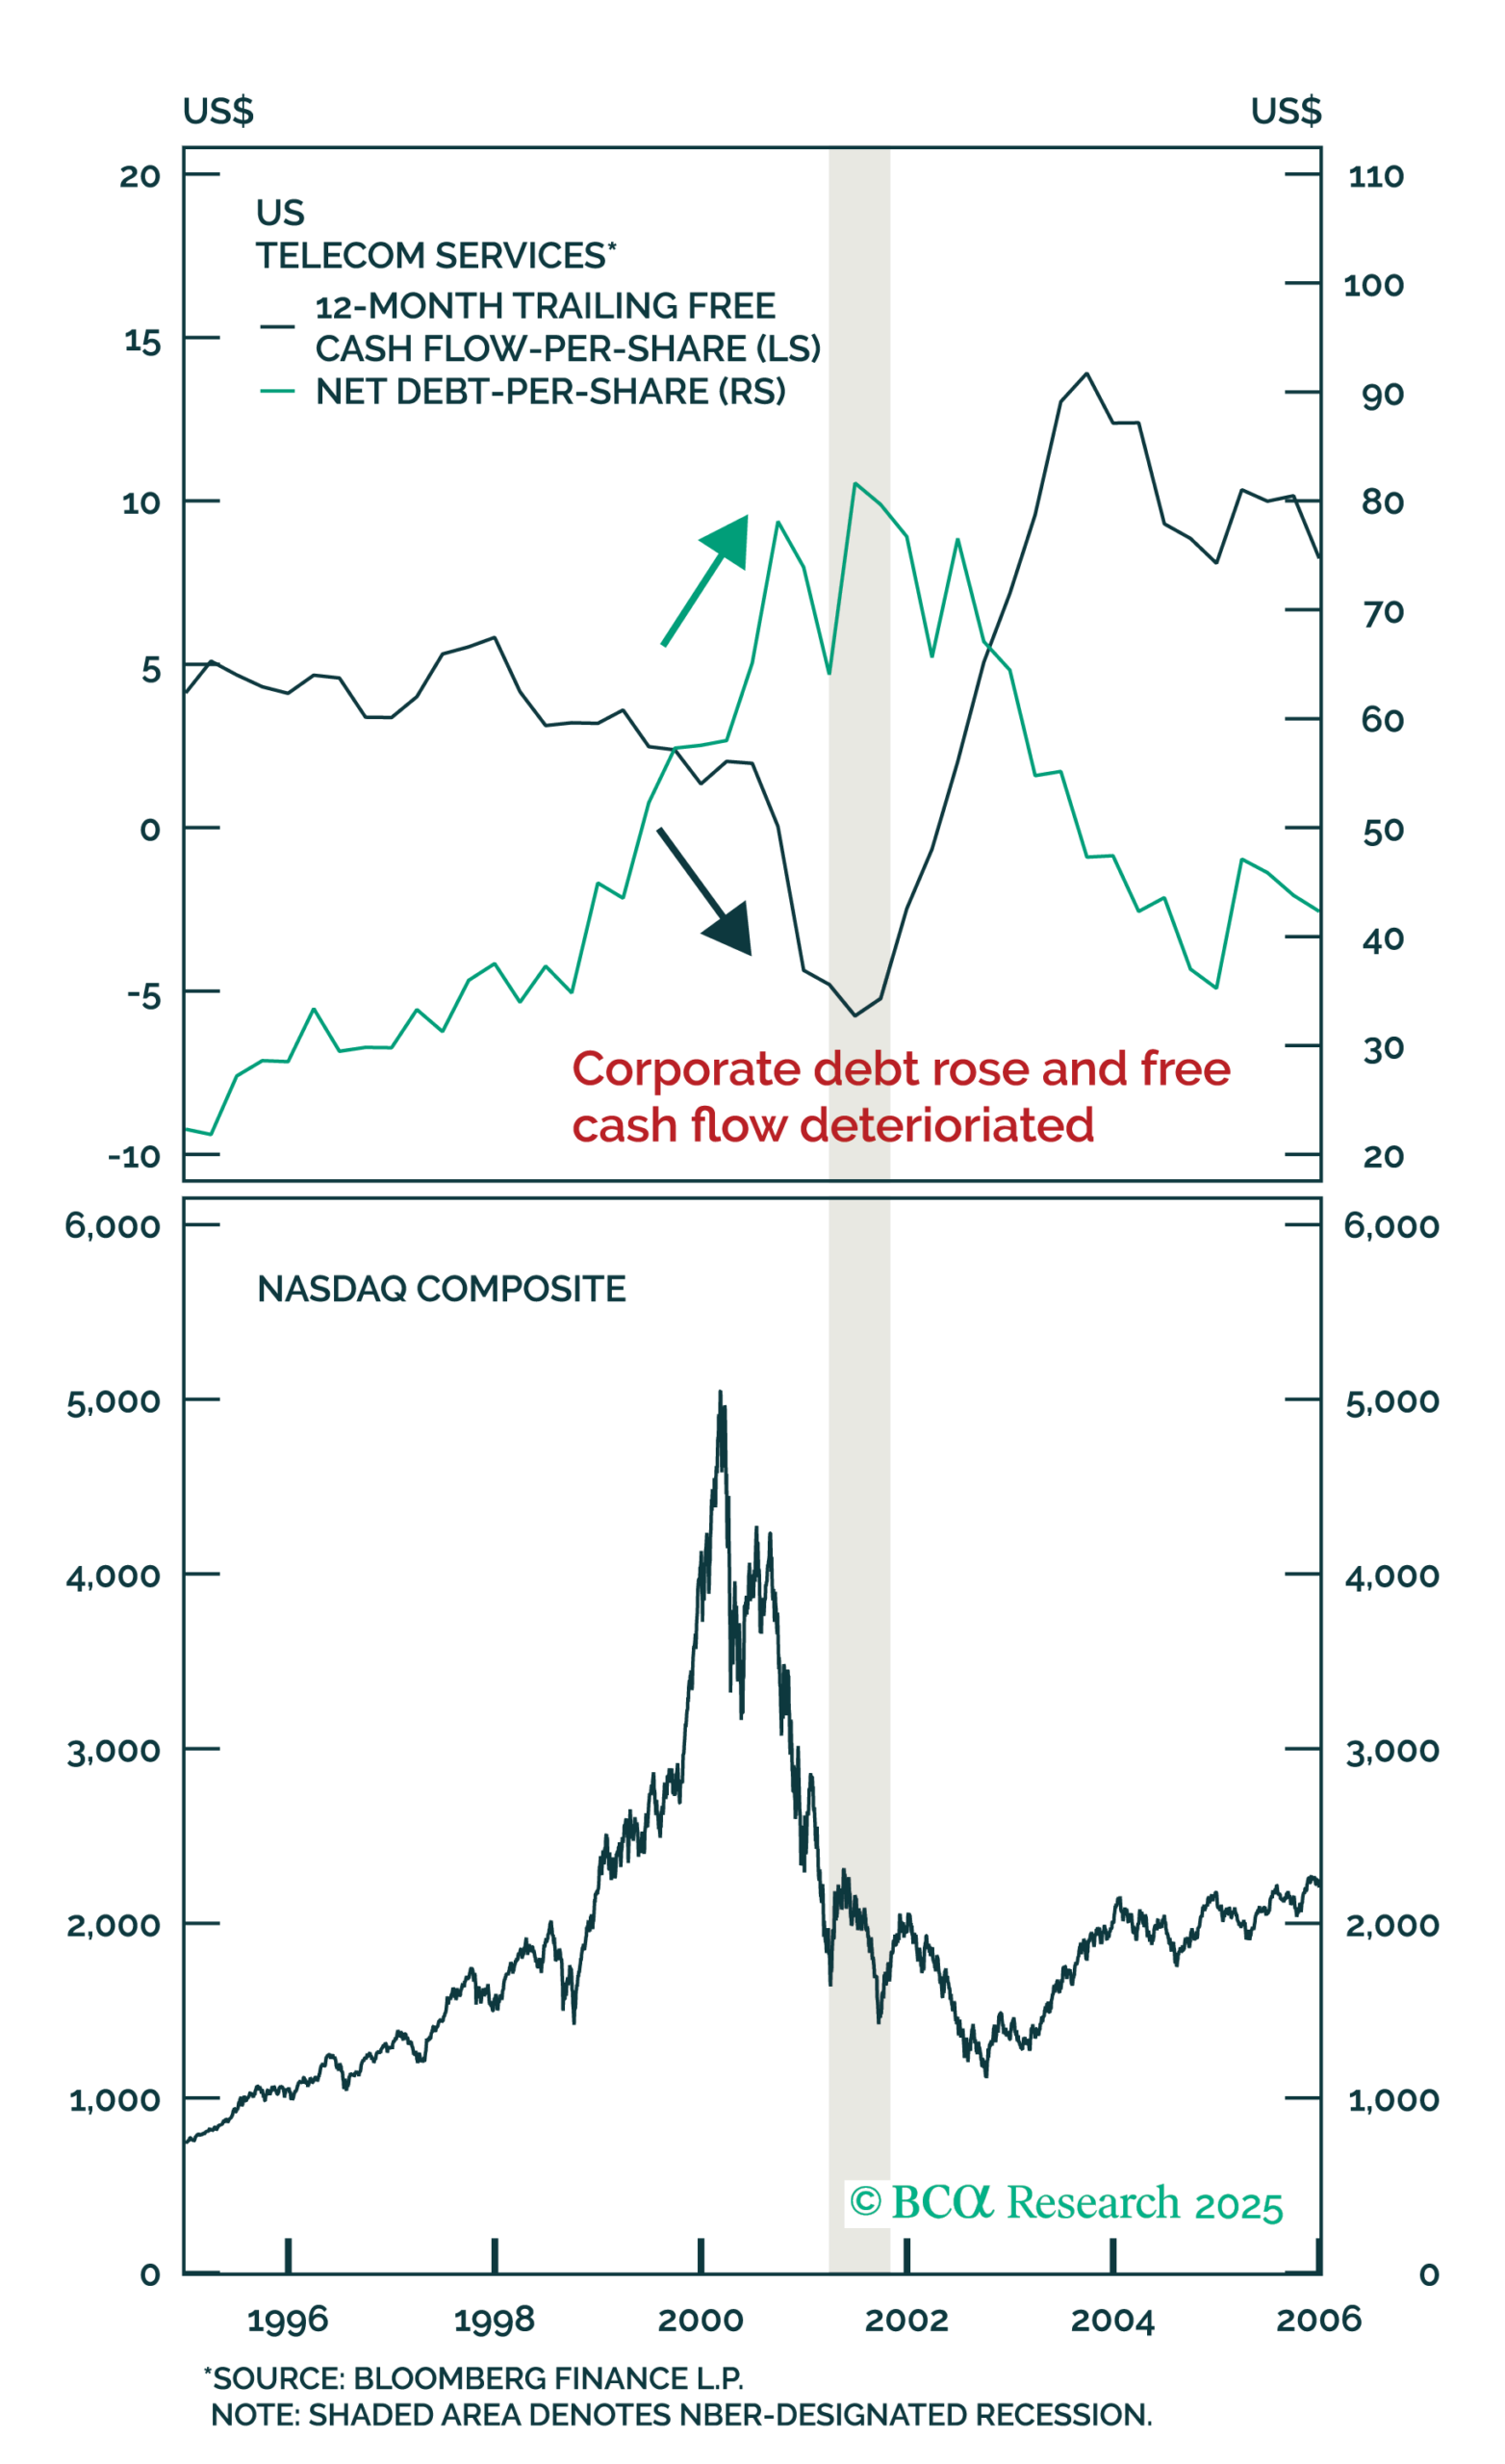
Figure 3 – Debt-driven capex expansions are a major warning sign
Across past investment booms such as railroads, electrification, and the internet, a reliable late-cycle indicator has been the shift from capex funded via internally generated cashflows, to debt-financed growth – see Figure 3. The consequential rise in leverage in each regime’s late-stage cycle thus amplified the downturns that followed.
As it stands, the fringes of the AI trade (and a growing proportion of the rest of the distribution) are relying heavily on a dovish monetary policy. In recent periods, the sentiment-driven valuations of these frontier players have fluctuated inversely to any economic prints that indicated an “improving economy”. The relationship is not illogical by itself, as the ability to finance the buildout of data centres and AI infrastructure on cheap money has become negatively correlated to the short-term health of the general economy, thanks to the “investment-by-all-means” mentality introduced by hyperscalers over the last year. We have seen hiccups and faith lost in this trade already, such as Oracle. Tech companies have so far justified this lavish spending on the grounds that AI would significantly boost their sales and profits. However, this will seem to require continuous investment until Artificial General Intelligence (“AGI”) appears, the next step in innovation beyond Large Language Models (“LLMs”). The question remains if we will continue to see the same level of innovation in AI throughout 2026, all while costs just keep rising.
Winter is coming
An AI winter would reflect a stagnation on the frontier, a point where every marginal increase in compute (the “cost to train”) leads to diminishing benefit in marginal inference (“the benefit gained per unit training cost”).
With what is publicly known, the occurrence of a winter could be more probable than most think.
Meta’s prior chief AI scientist, Yann LeCun, left the role in late 2025. LeCun believes that the actual ceiling in the capability of LLMs is a lot lower than what people assume as “artificial intelligence”. LLMs are useful at processing and reciting old knowledge. Broad adoption of LLMs would provide a way to redistribute current knowledge and create productivity gains via a “levelling of the playing field”. However, as it stands, AI is not materially capable of innovation or forming knowledge that has not been already published (and thereby trained upon). For example, a study by METR found that experienced programmers who had access to AI took 19% longer to finish their tasks than those who did not – see Figure 4.
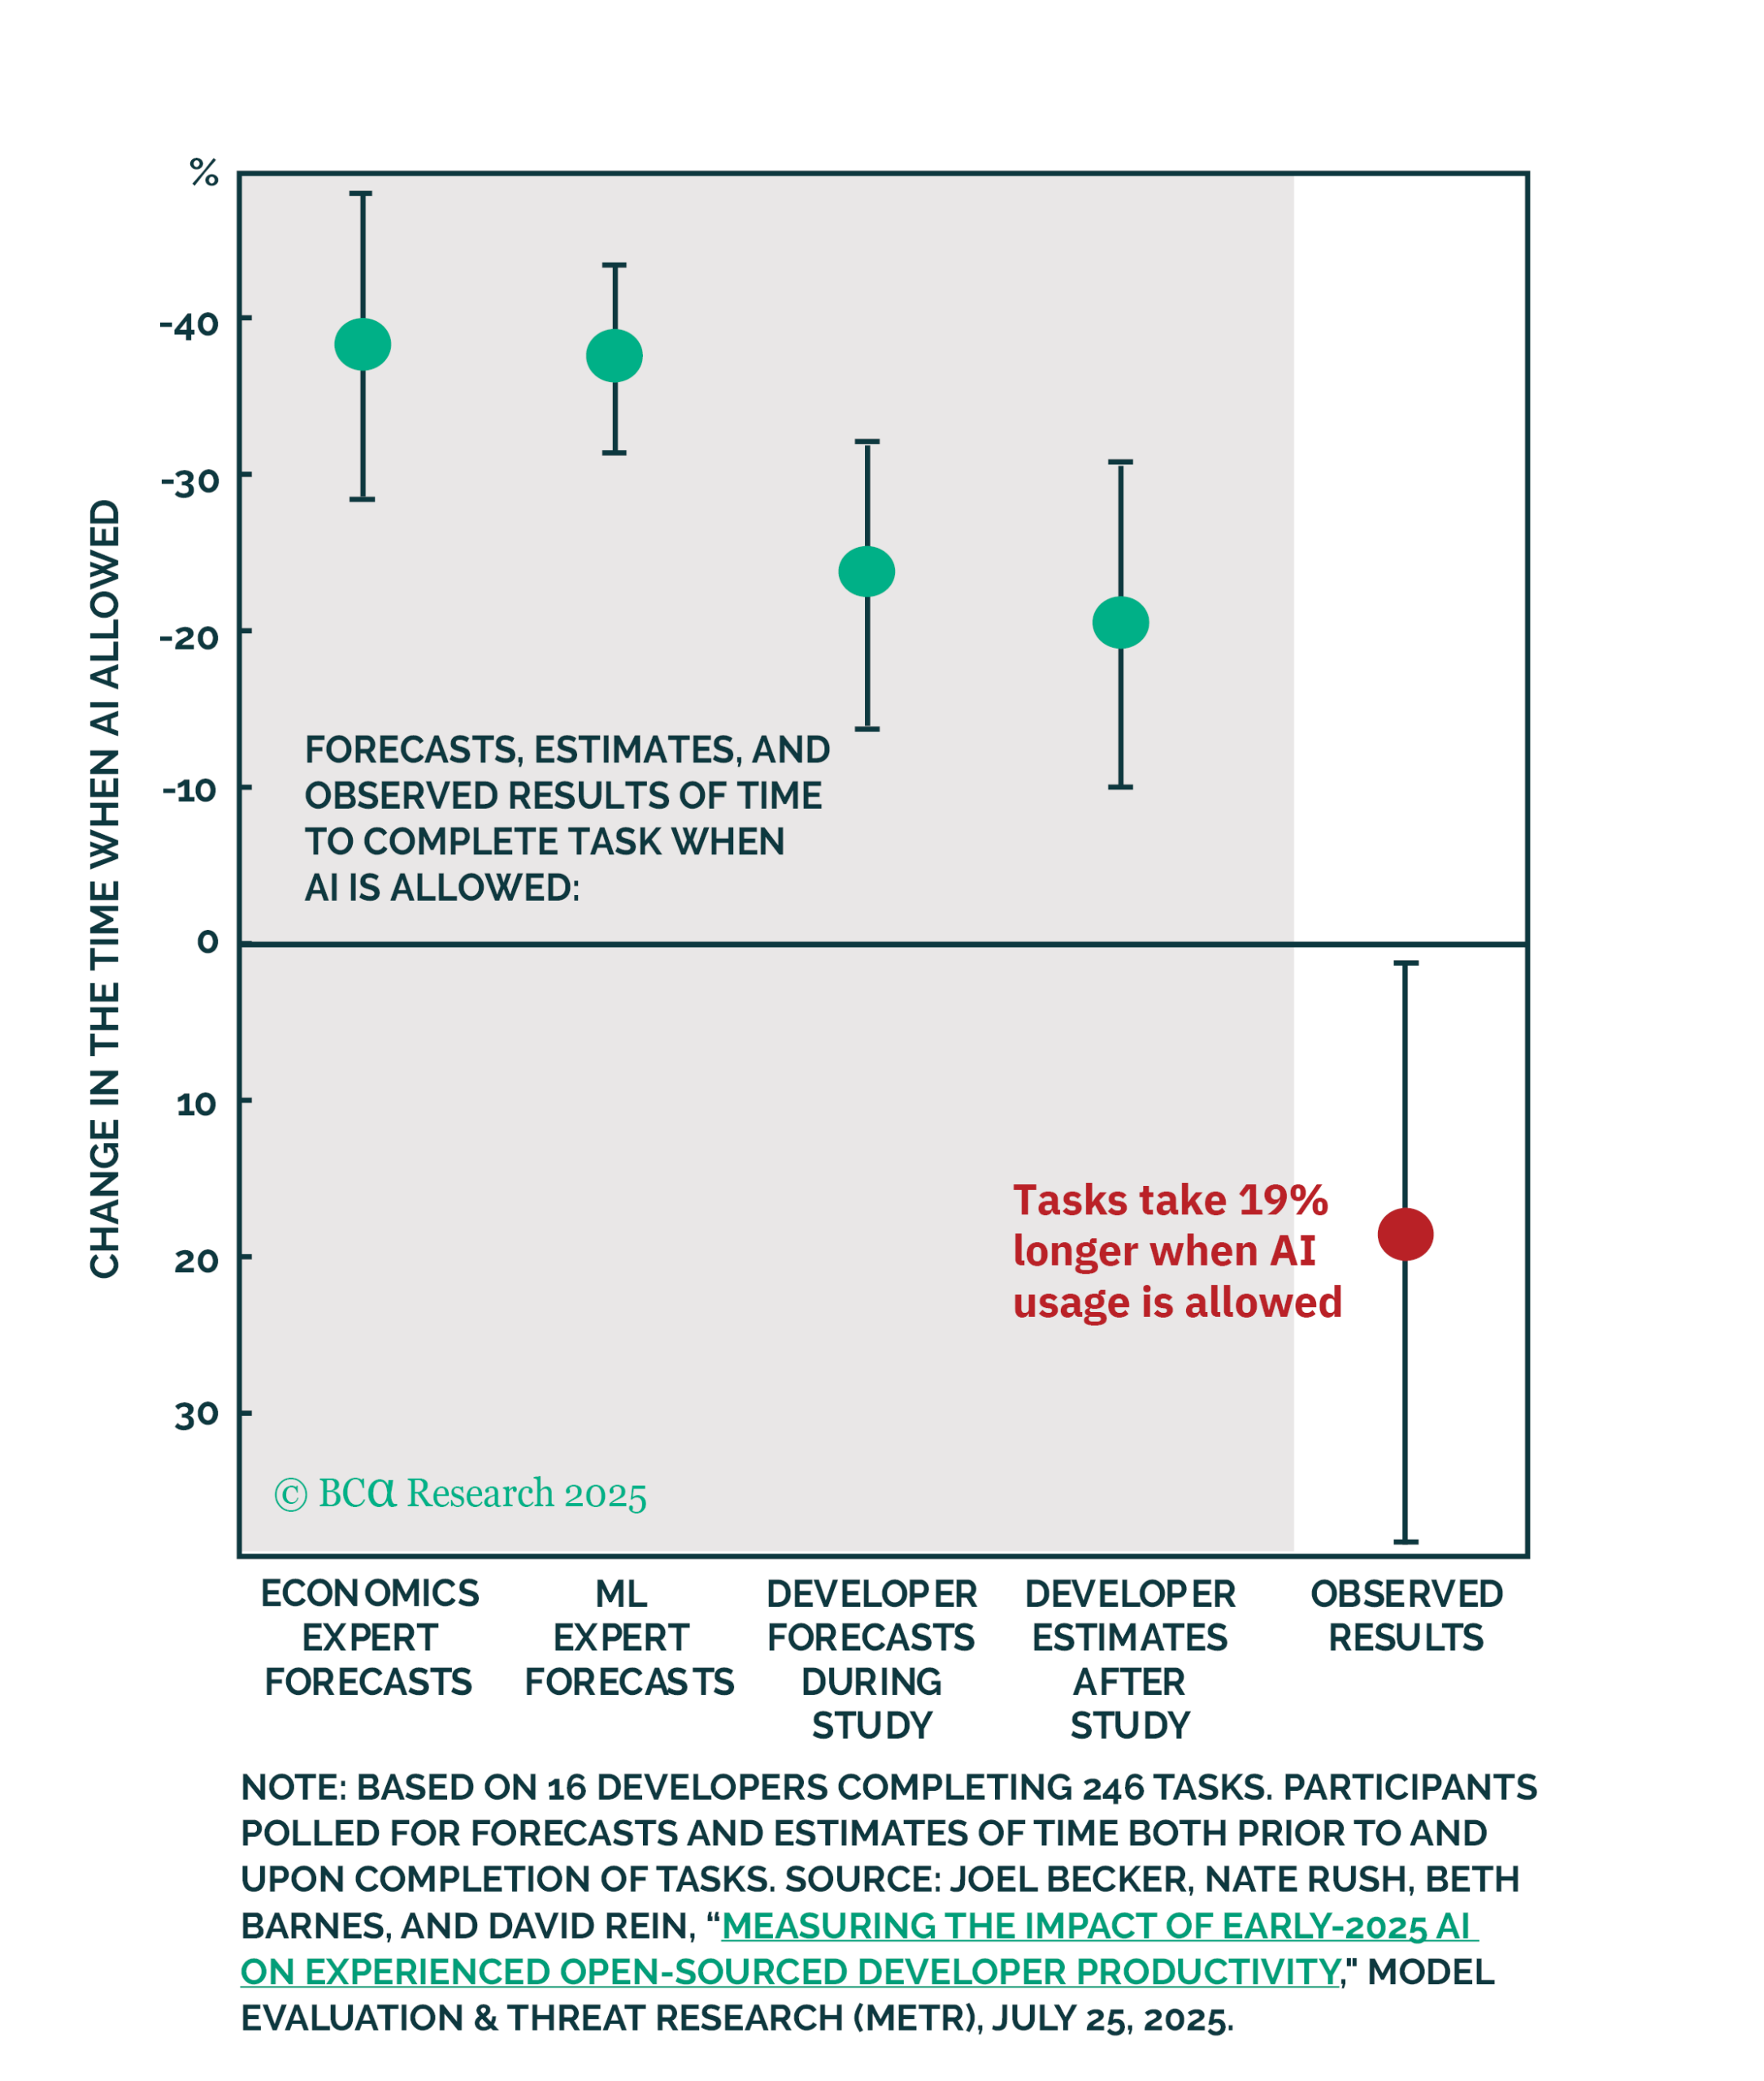
Figure 4 – AI adoption could help redistribute the knowledge gap, but cannot yet replace the upper levels of human capital
The enticing idea of true AGI being imminent has frothed valuations, despite the roadmap for such tech being anywhere from a year to a generation away. The risk to AI for 2026, is that in lieu of an AGI breakthrough, marginal inference per training cost could reach a plateau for LLMs. As the probability of this flattening becomes more certain, it will gradually build a concrete ceiling over AI valuations which have so far enjoyed a “sky-is-the-limit” form of pricing. This correction, for one, would come in the form of a grounding in revenue outlooks, which has been built up by the trend of circular partnerships among AI enablers and monetisers. For reference, the S&P 500 is currently valued at a price-to-sales ratio that is 48% higher than its March 2000 peak – see Figure 5.
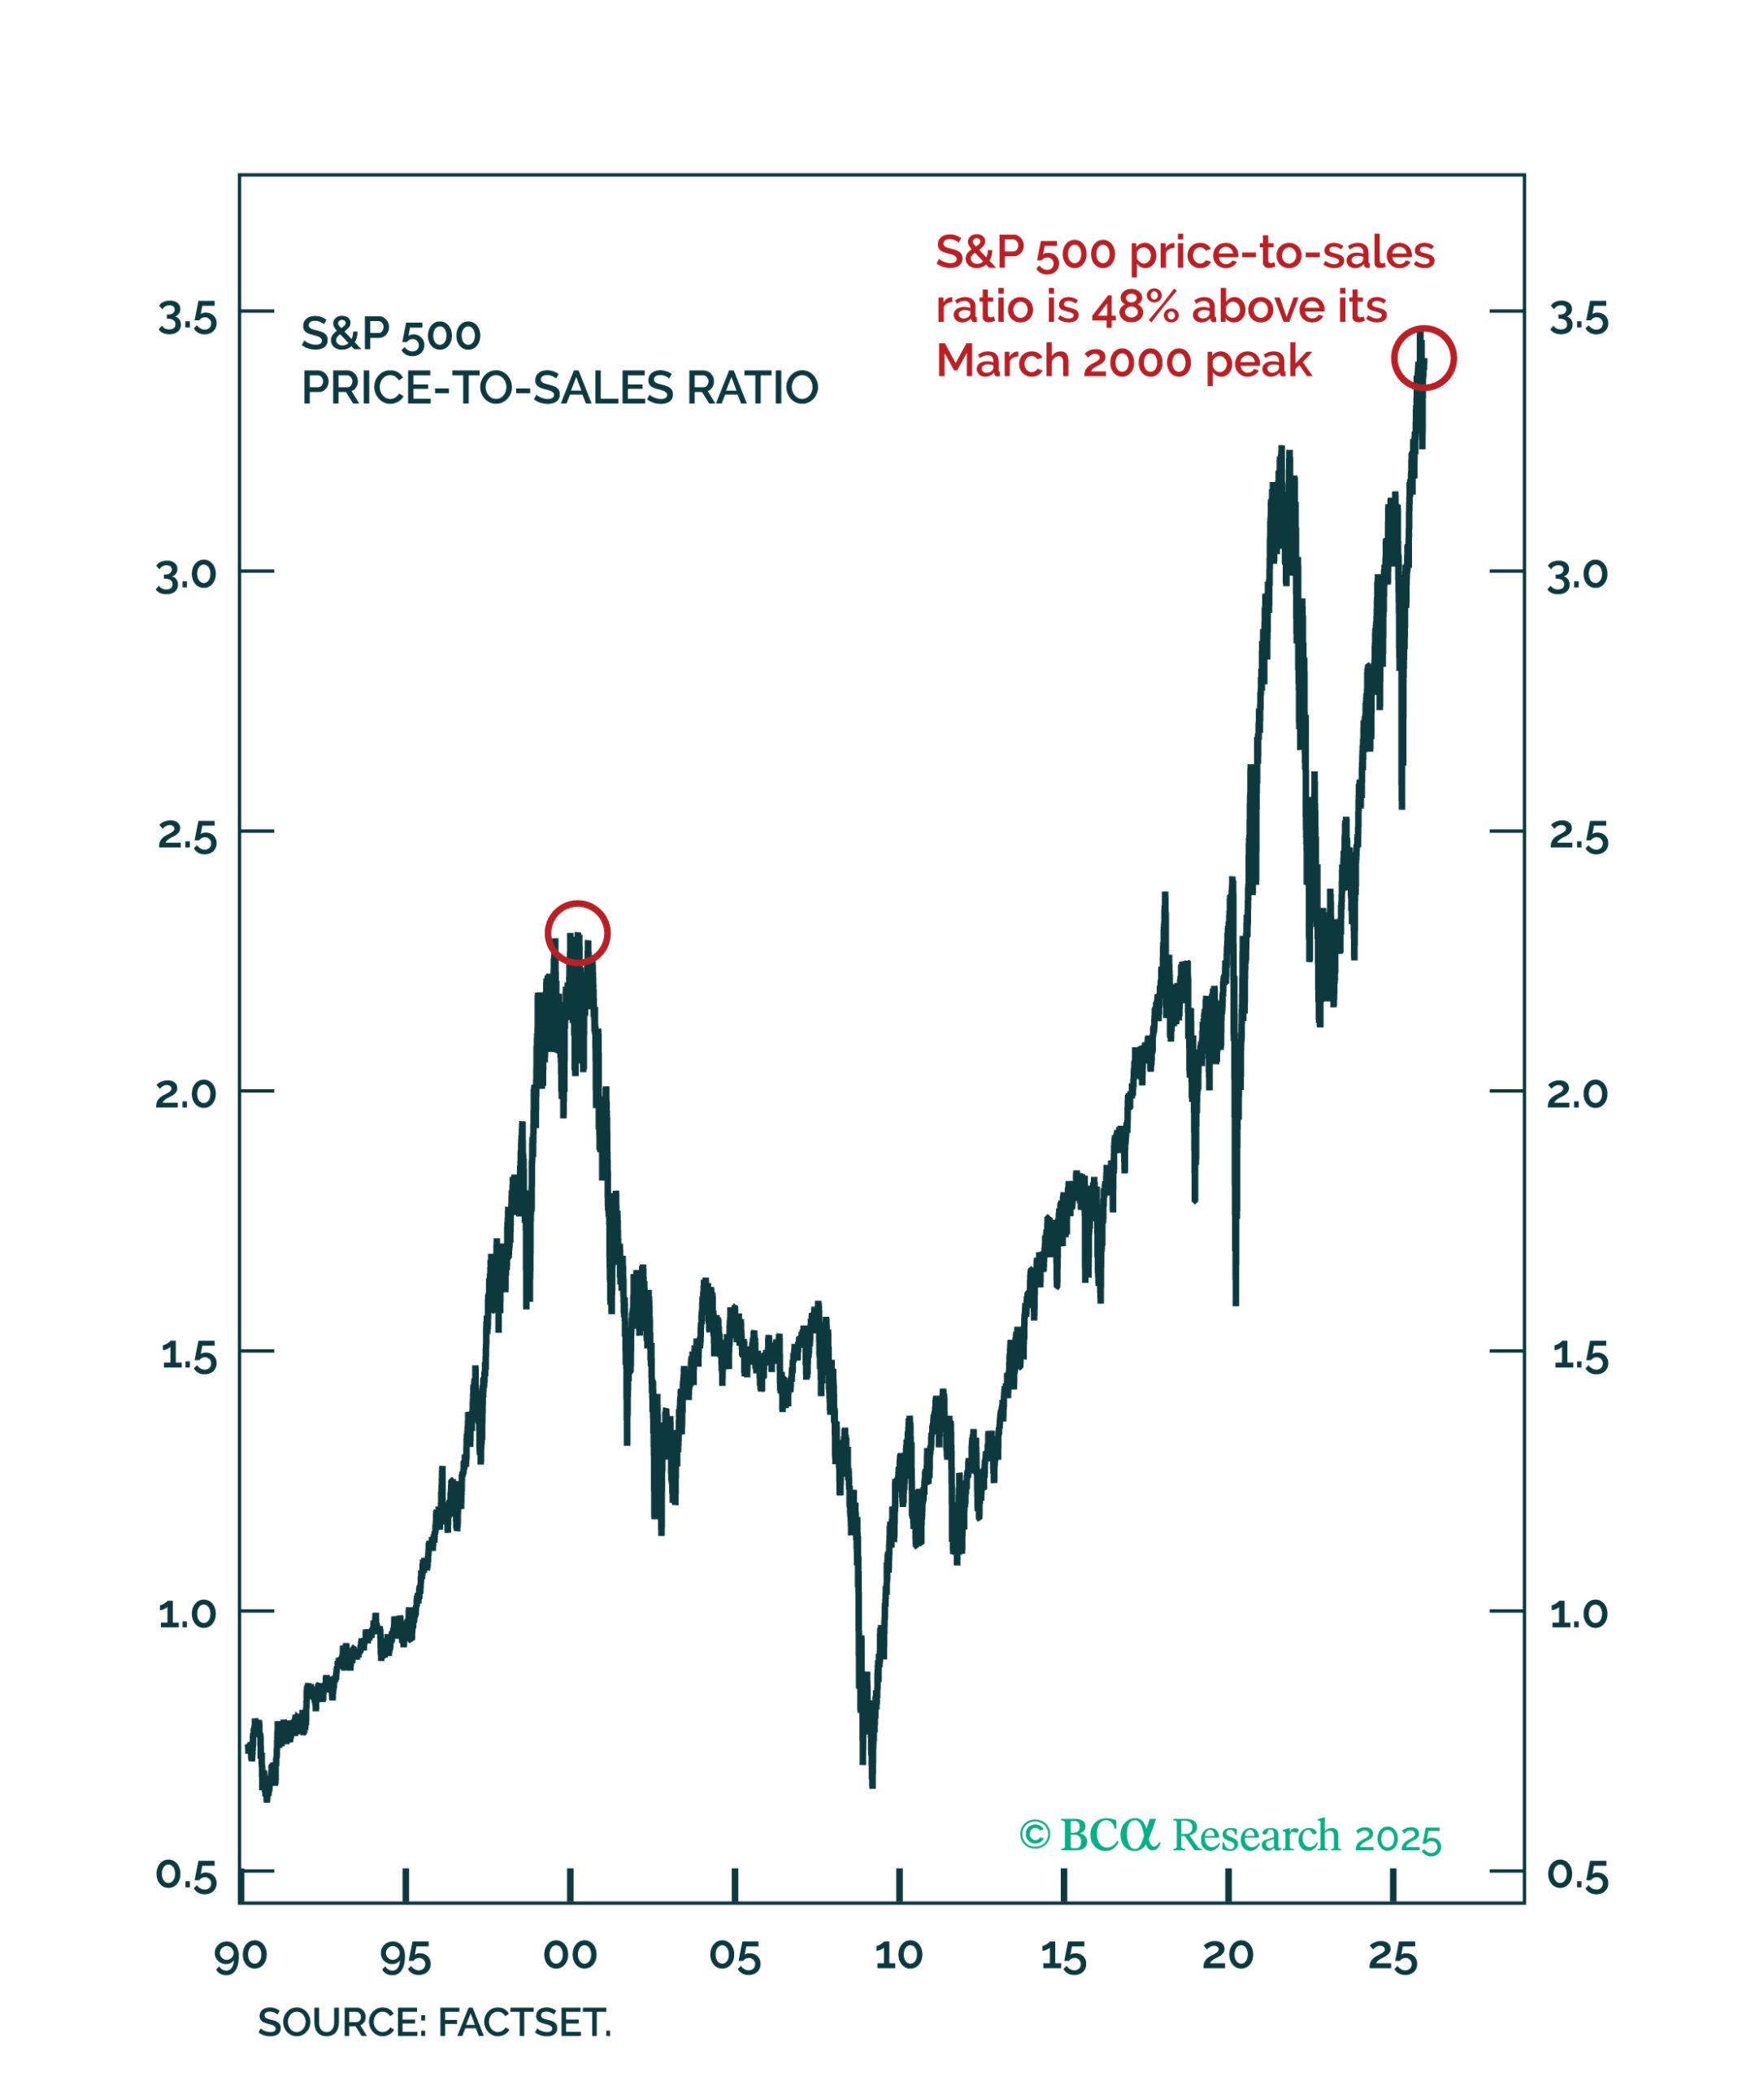
Figure 5 – On a price-to-sales basis, US shares are more expensive than at the dotcom bubble peak
Simply put, if a training plateau is reached in 2026, and AI monetisers get no marginal benefit from the next GPU bought for training, the trillions in revenue commitments promised for the subsequent 5 years will become heavily discounted by investors today.
Over the medium term, some downstream AI adopters could still see reasonable risk-adjusted upside potential on our base case (i.e. a more-than-likely AI winter to emerge within the next 12 months). While progress at the frontier stagnates, certain laggards in AI adoption will begin to “catch up”, learning to integrate AI toolsets in optimal ways and enhancing productivity in monotonous interim labour. For example, the automation of data-cleanup admin in biotech. The specialisation of such a role might require the domain expert themselves to handle routine or process-driven work that take away hours from their true value-add work. AI integration in these circumstances could improve productivity and profitability without the cost of unemployment through redundancy.
The economy: A reversal in the K-shaped economy
GDP growth for 2025 appears robust on GDPNow forecasts, in part thanks to productivity growth – see Figure 6. Many would think this is purely linked to AI adoption.
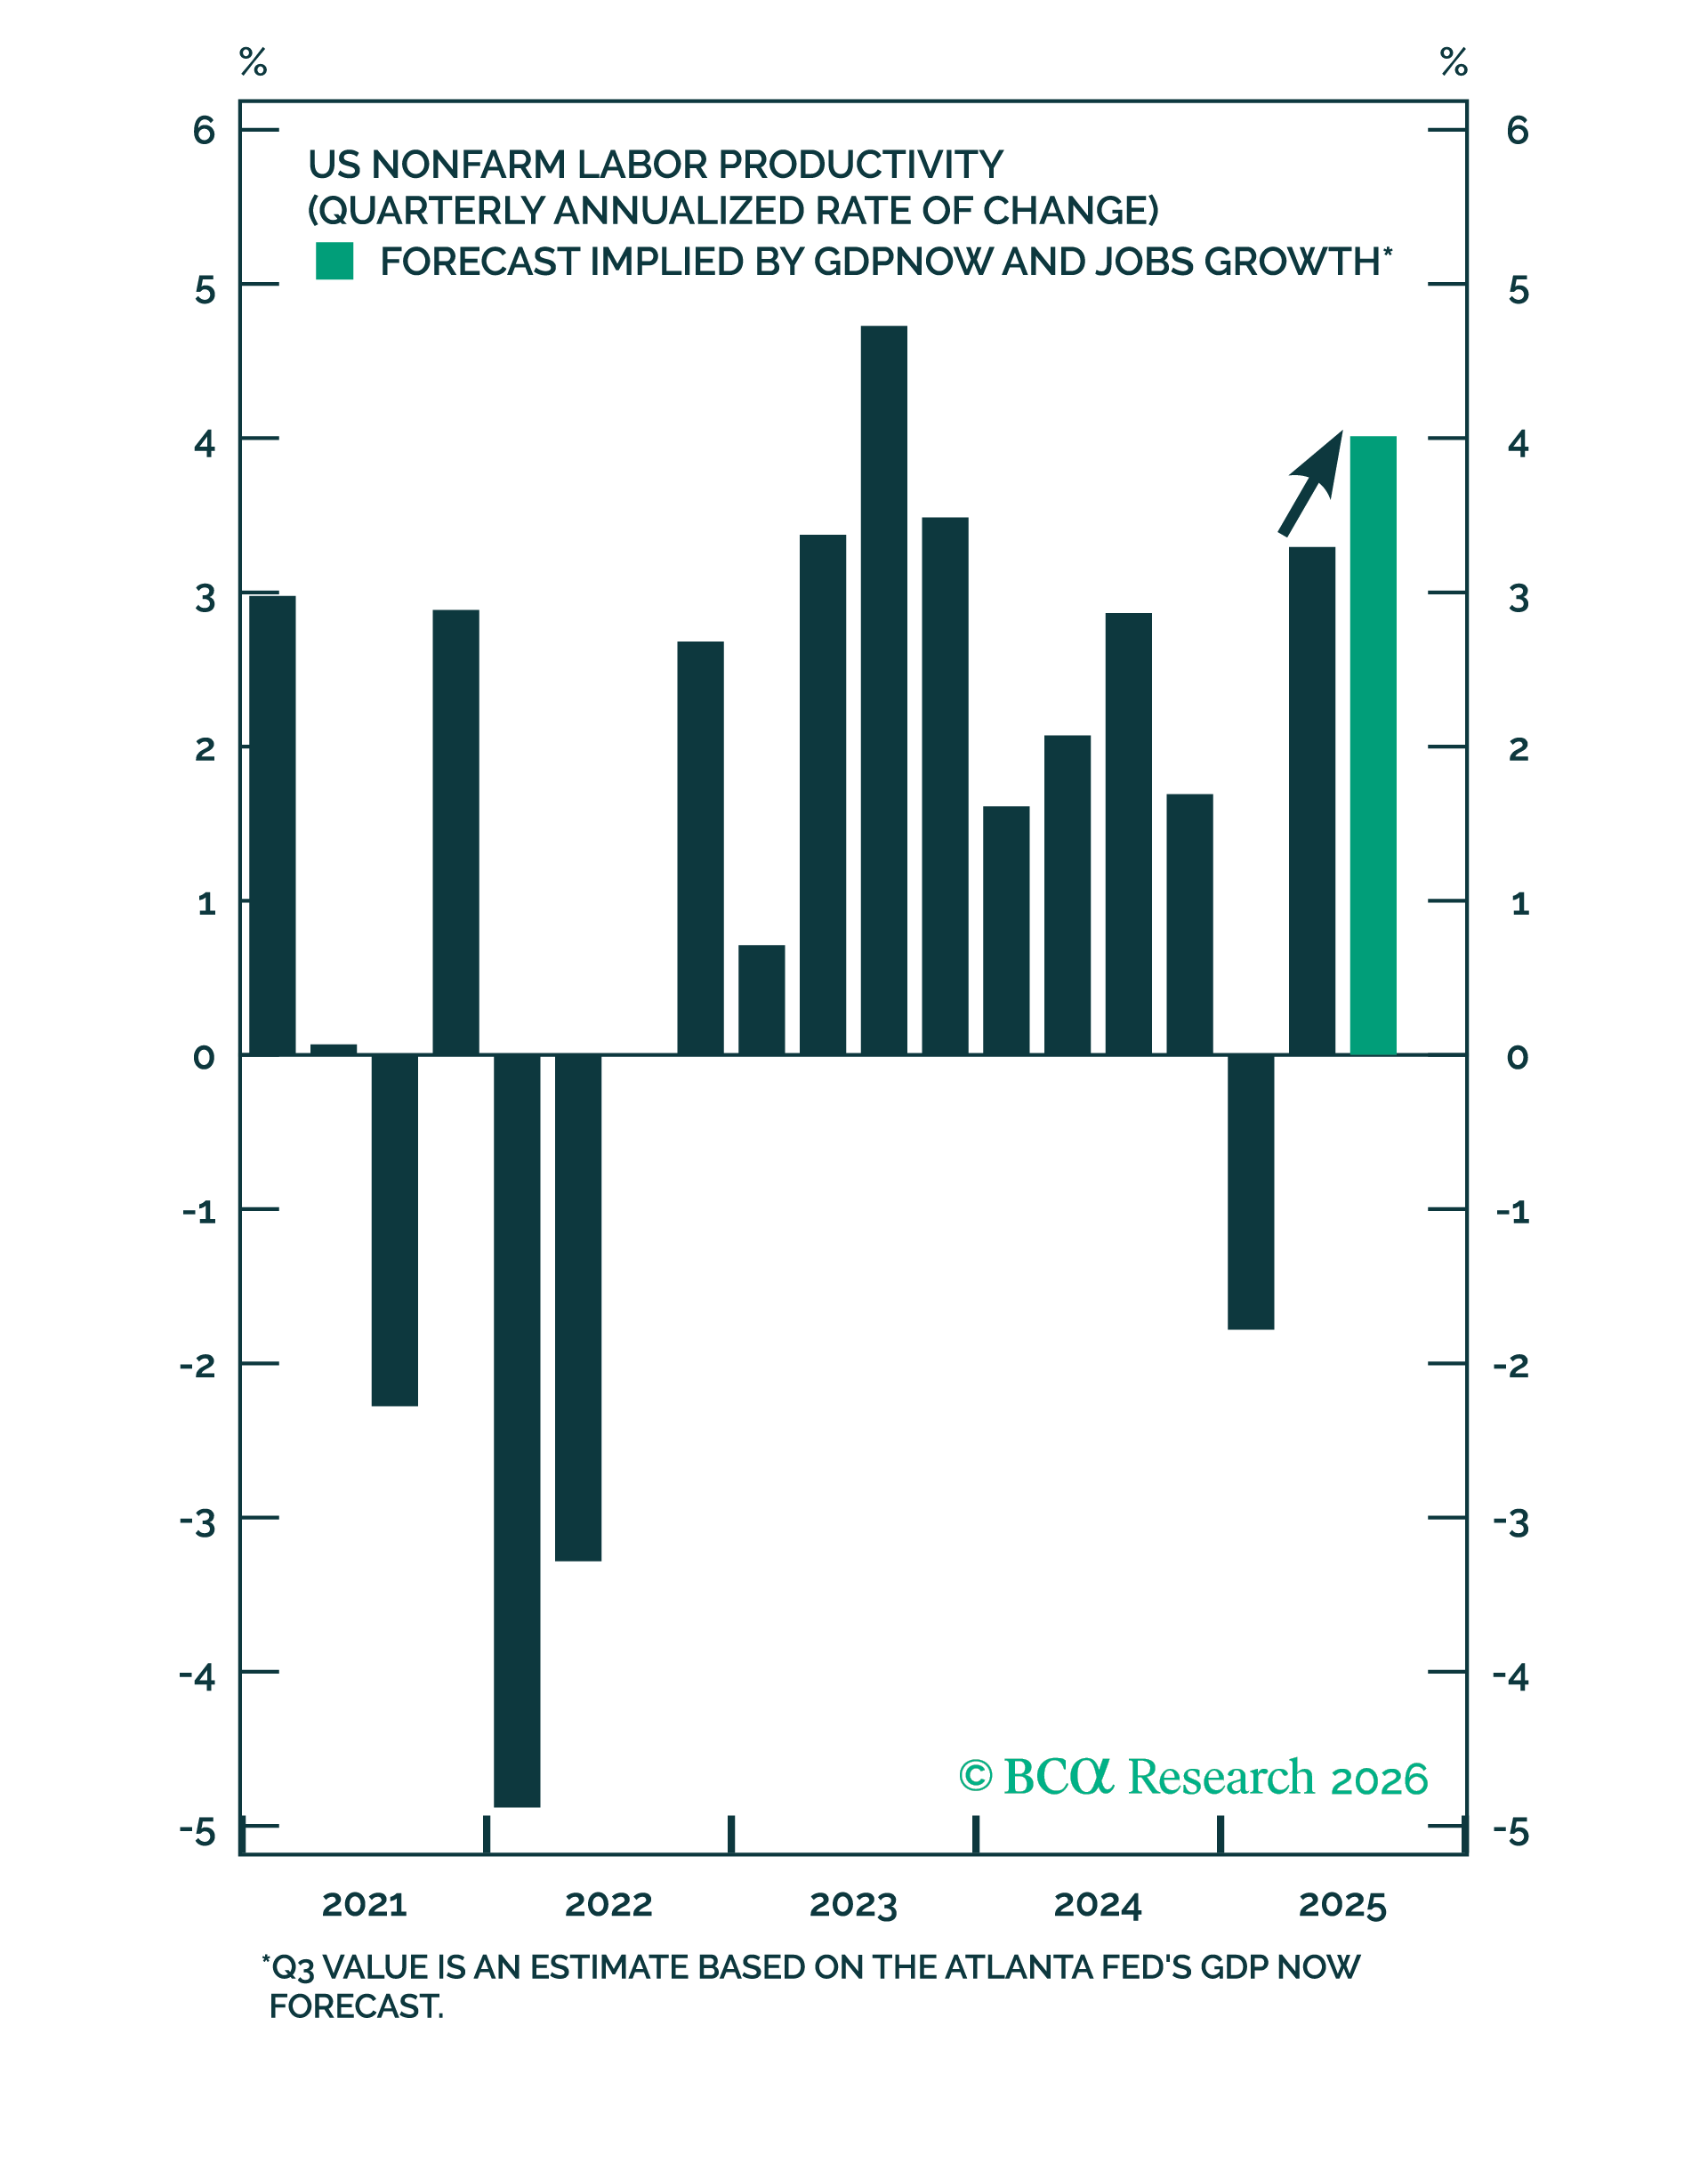
Figure 6 – Labour productivity appears to be “strong” as 2025 ends
When investors hear the term “productivity,” they assume a supply-side interpretation. A more productive economy is understood as one that can generate more output with the same amount of inputs (usually labour) or produce the same level of output with fewer resources. This framing is appropriate over the long run. In the short run, however, measured productivity is also influenced by shifts in demand. When output grows faster than the labour input because firms can meet the higher demand with only a limited increase in hiring, measured productivity will rise even without any underlying improvement in efficiency.
Interestingly, output per hour worked, or “productivity”, typically surges during recessions. In these moments, productivity stems from workforce reductions that raise output per worker as remaining employees are required to absorb more work.
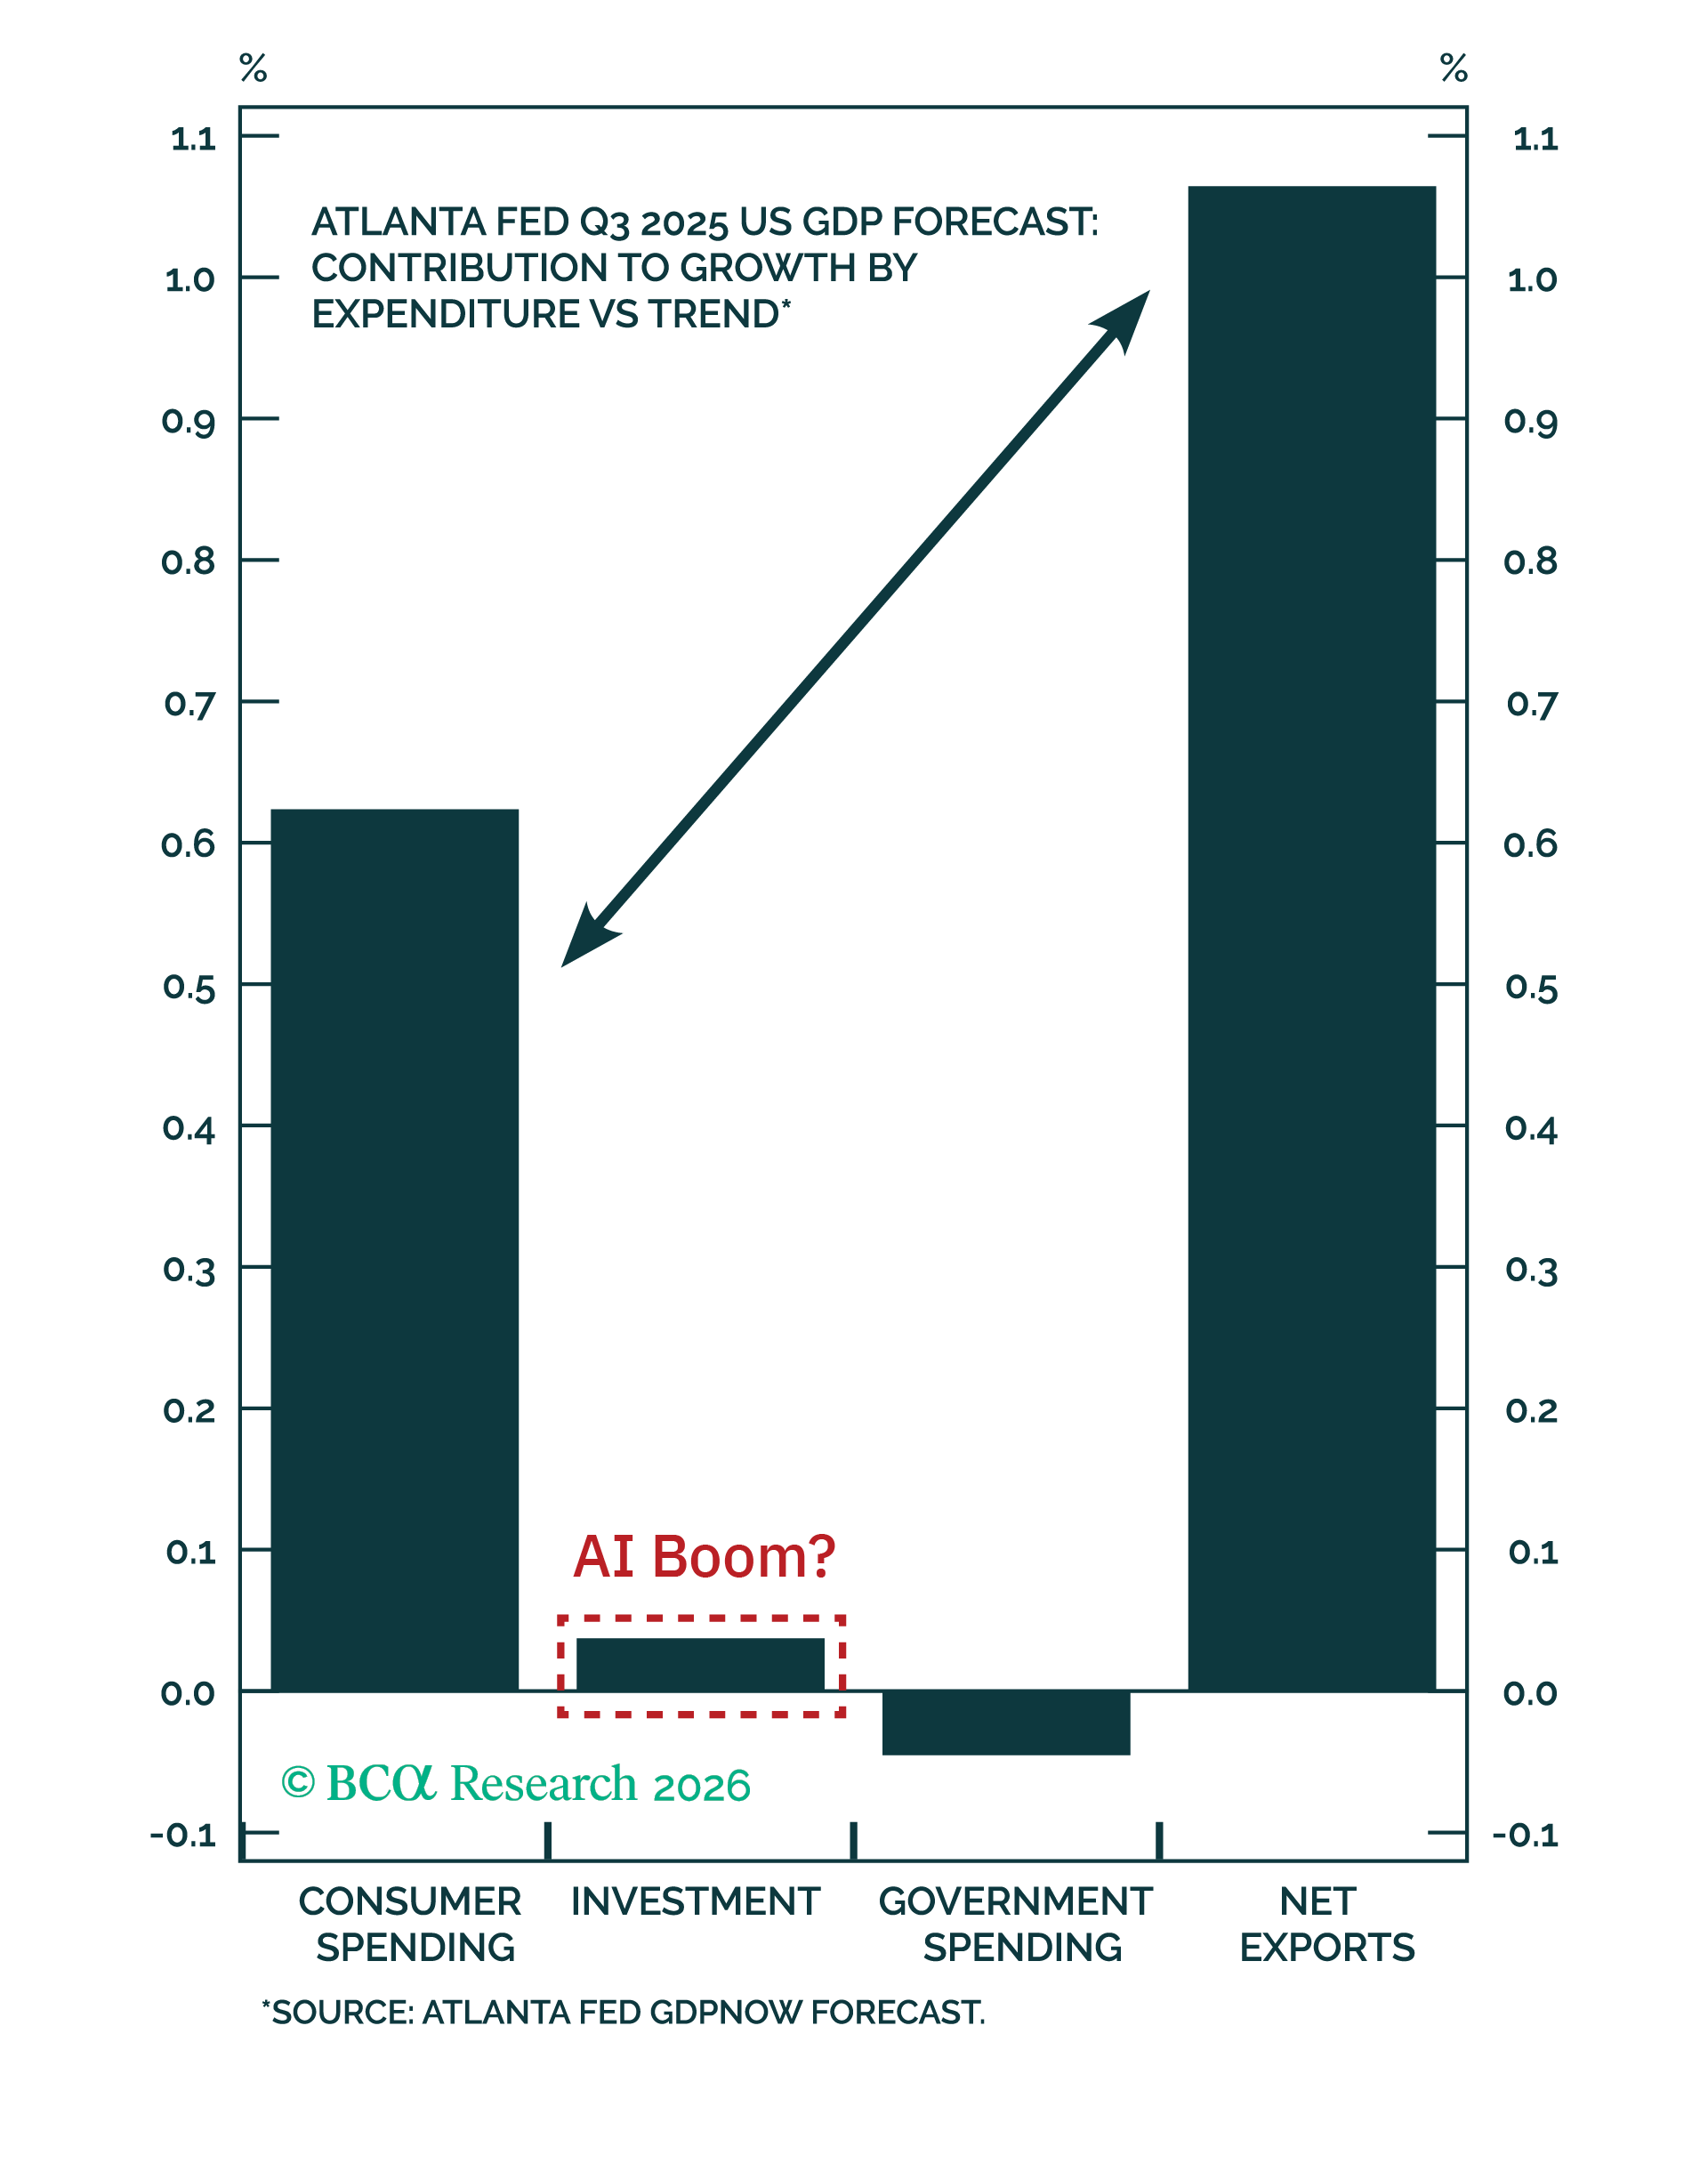
Figure 7 – Consumption has remained as the primary domestic contributor to US GDP growth
Viewing Figure 7, GDP growth has relied heavily on robust consumer spending. In practice, consumption has historically been anchored by middle-income households, which account for a majority share of aggregate demand – see Figure 8.
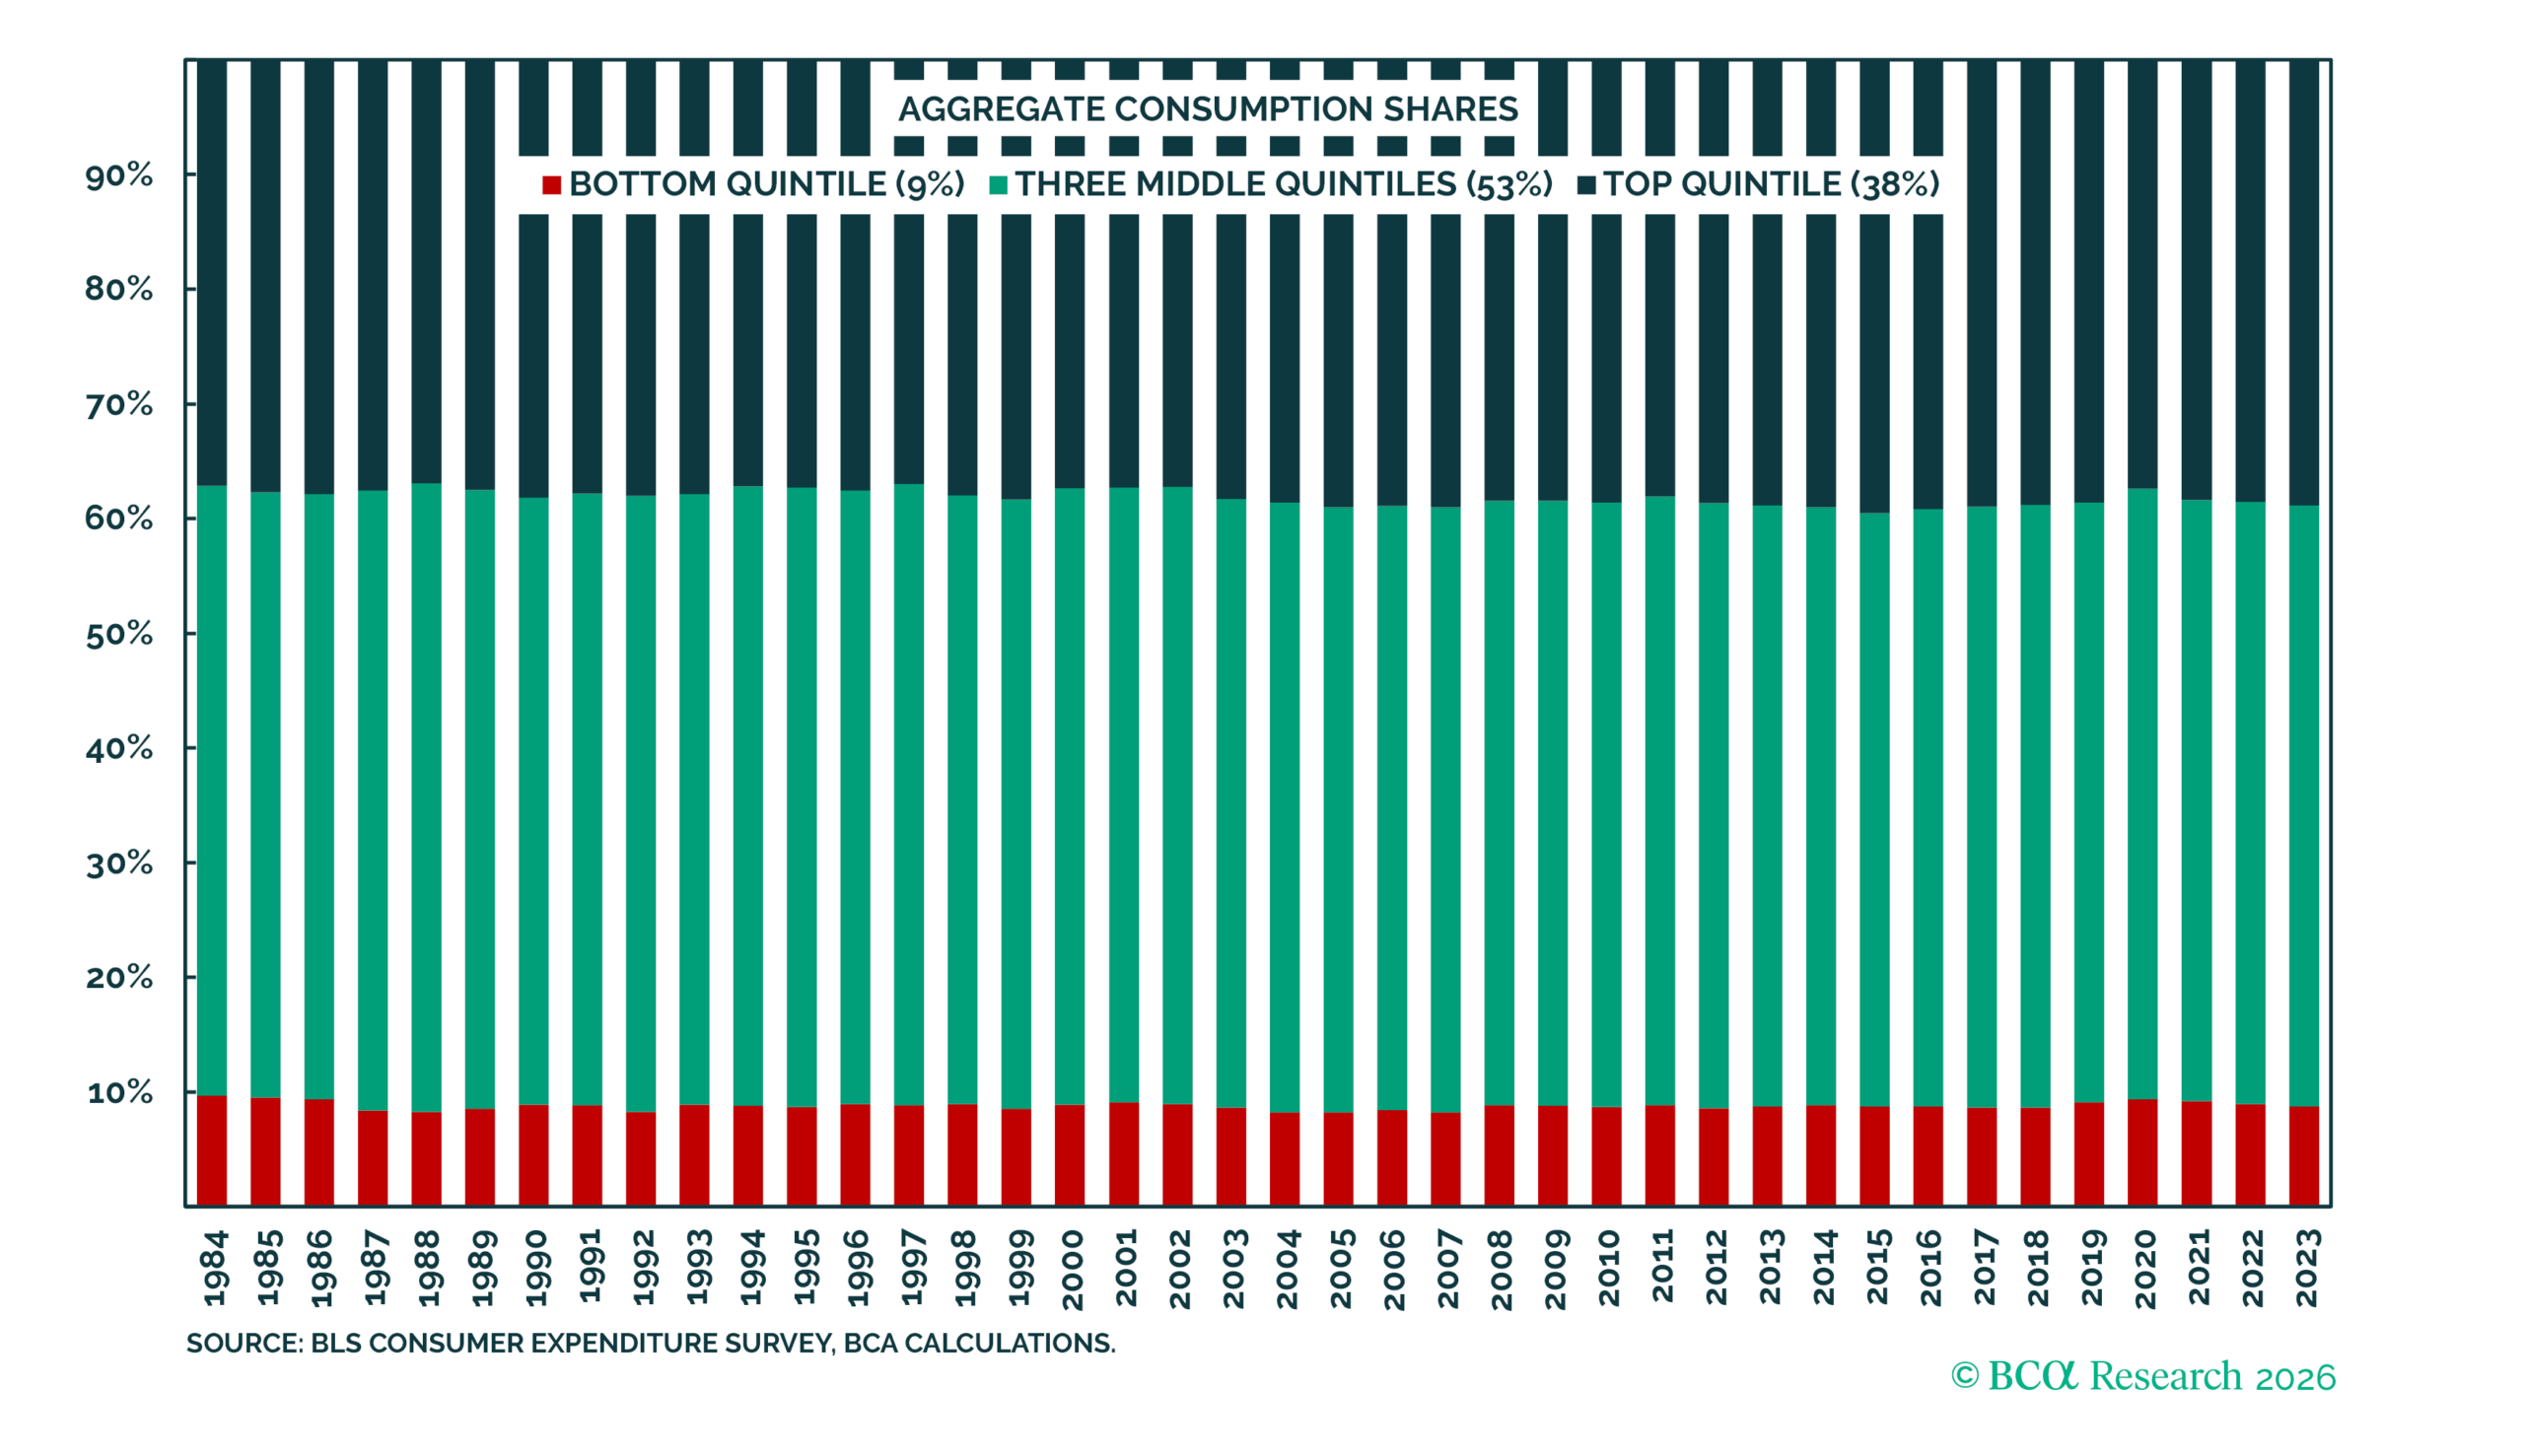
Figure 8 – The middle quintiles have always out-consumed the top quintile
The broad middle acts as the key “swing factor” in the consumption cycle, as its marginal propensity to consume (“MPC”) is relatively sensitive to changes in income. By contrast, the top quintile of higher-income households contributes less to incremental consumption because of their structurally lower MPC (richer households already over satisfy their consumption needs). Thus, while they have benefited from asset price appreciation under the current regime, these wealth effects translate weakly into broader demand growth, limiting the US from relying on the wealthy to keep consumption robust in the case of a widespread reduction in middle-class spending.
Looking back at the pandemic, large fiscal transfers temporarily lifted middle-income purchasing power well above underlying wage income. As this buffer was spent down, many households slipped toward the lower leg of the K-shaped distribution. This matters because the prior fiscal mechanisms supporting consumption have narrowed. Simply, households can fund spending through 1) past income, 2) borrowing against future income, or 3) current income. Past savings have largely been exhausted, while credit demand remains weak, especially outside the upper income brackets, likely due to credit trauma from the Global Financial Crisis (“GFC”). This makes current income a central determinant of consumption for 2026.
Current income consists of labour compensation and investment income, and the effect on consumption for each unit of household income gained or lost, differs sharply per household – as measured by the MPC metric. Investment income and capital gains were abundant during 2025, but mainly concentrated among higher-income households, who have a low MPC. As a result, even strong asset price appreciation has so far translated into limited incremental spending.
Labour compensation, by contrast, carries a much higher, and uniform, influence on the broad economy’s average MPC. Lower and middle-income households rely primarily on wages and employment to sustain spending. Unfortunately, the labour market has been losing momentum for some time. Job openings have trended lower since early 2022. Although official data showed a brief rebound in late 2025, high-frequency indicators such as Indeed and LinkUp continued to point to underlying weakness – see Figure 9.
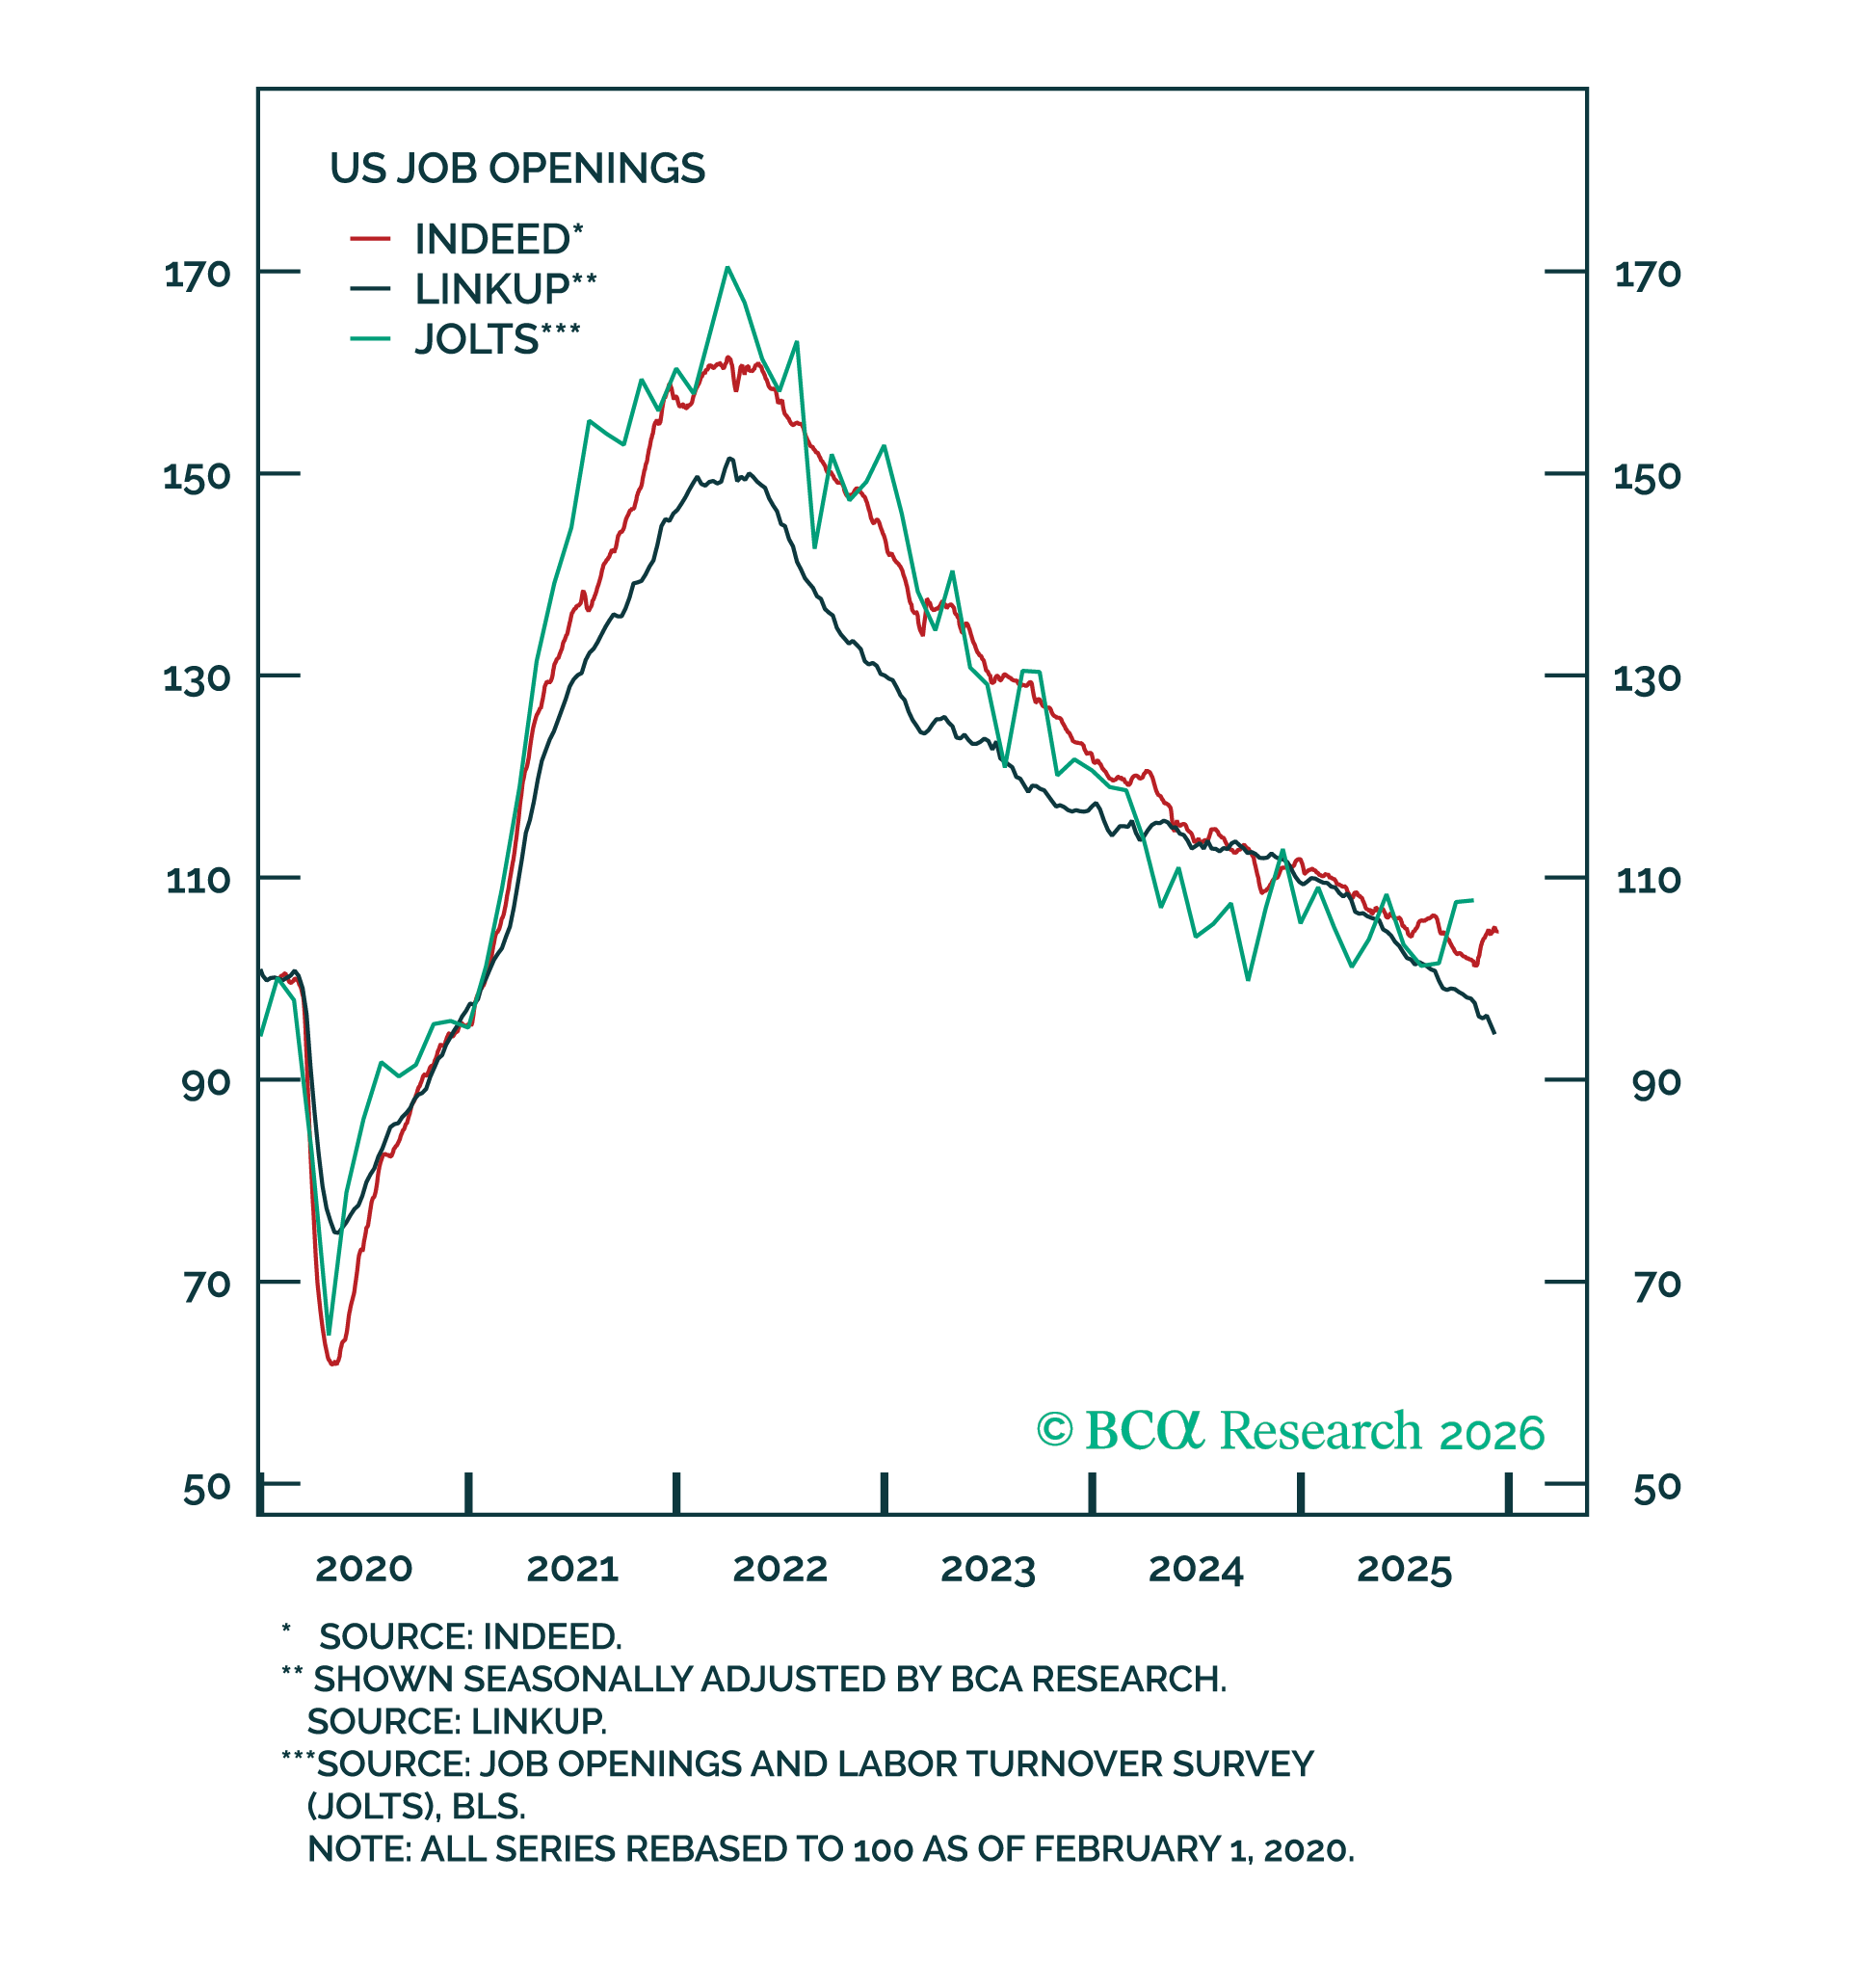
Figure 9 – Real-time measures of job openings continued to decline in 2025
For some time, this falling in job openings did not translate into higher unemployment because of persistent labour shortages (likely spurred by Trump’s immigration crackdowns). By late 2025, however, labour demand and supply had largely converged, placing the economy at the kink of the Beveridge curve. Empirical evidence has shown that from this point, further declines in job openings are more likely to result in a meaningful rise in unemployment – see Figure 10.
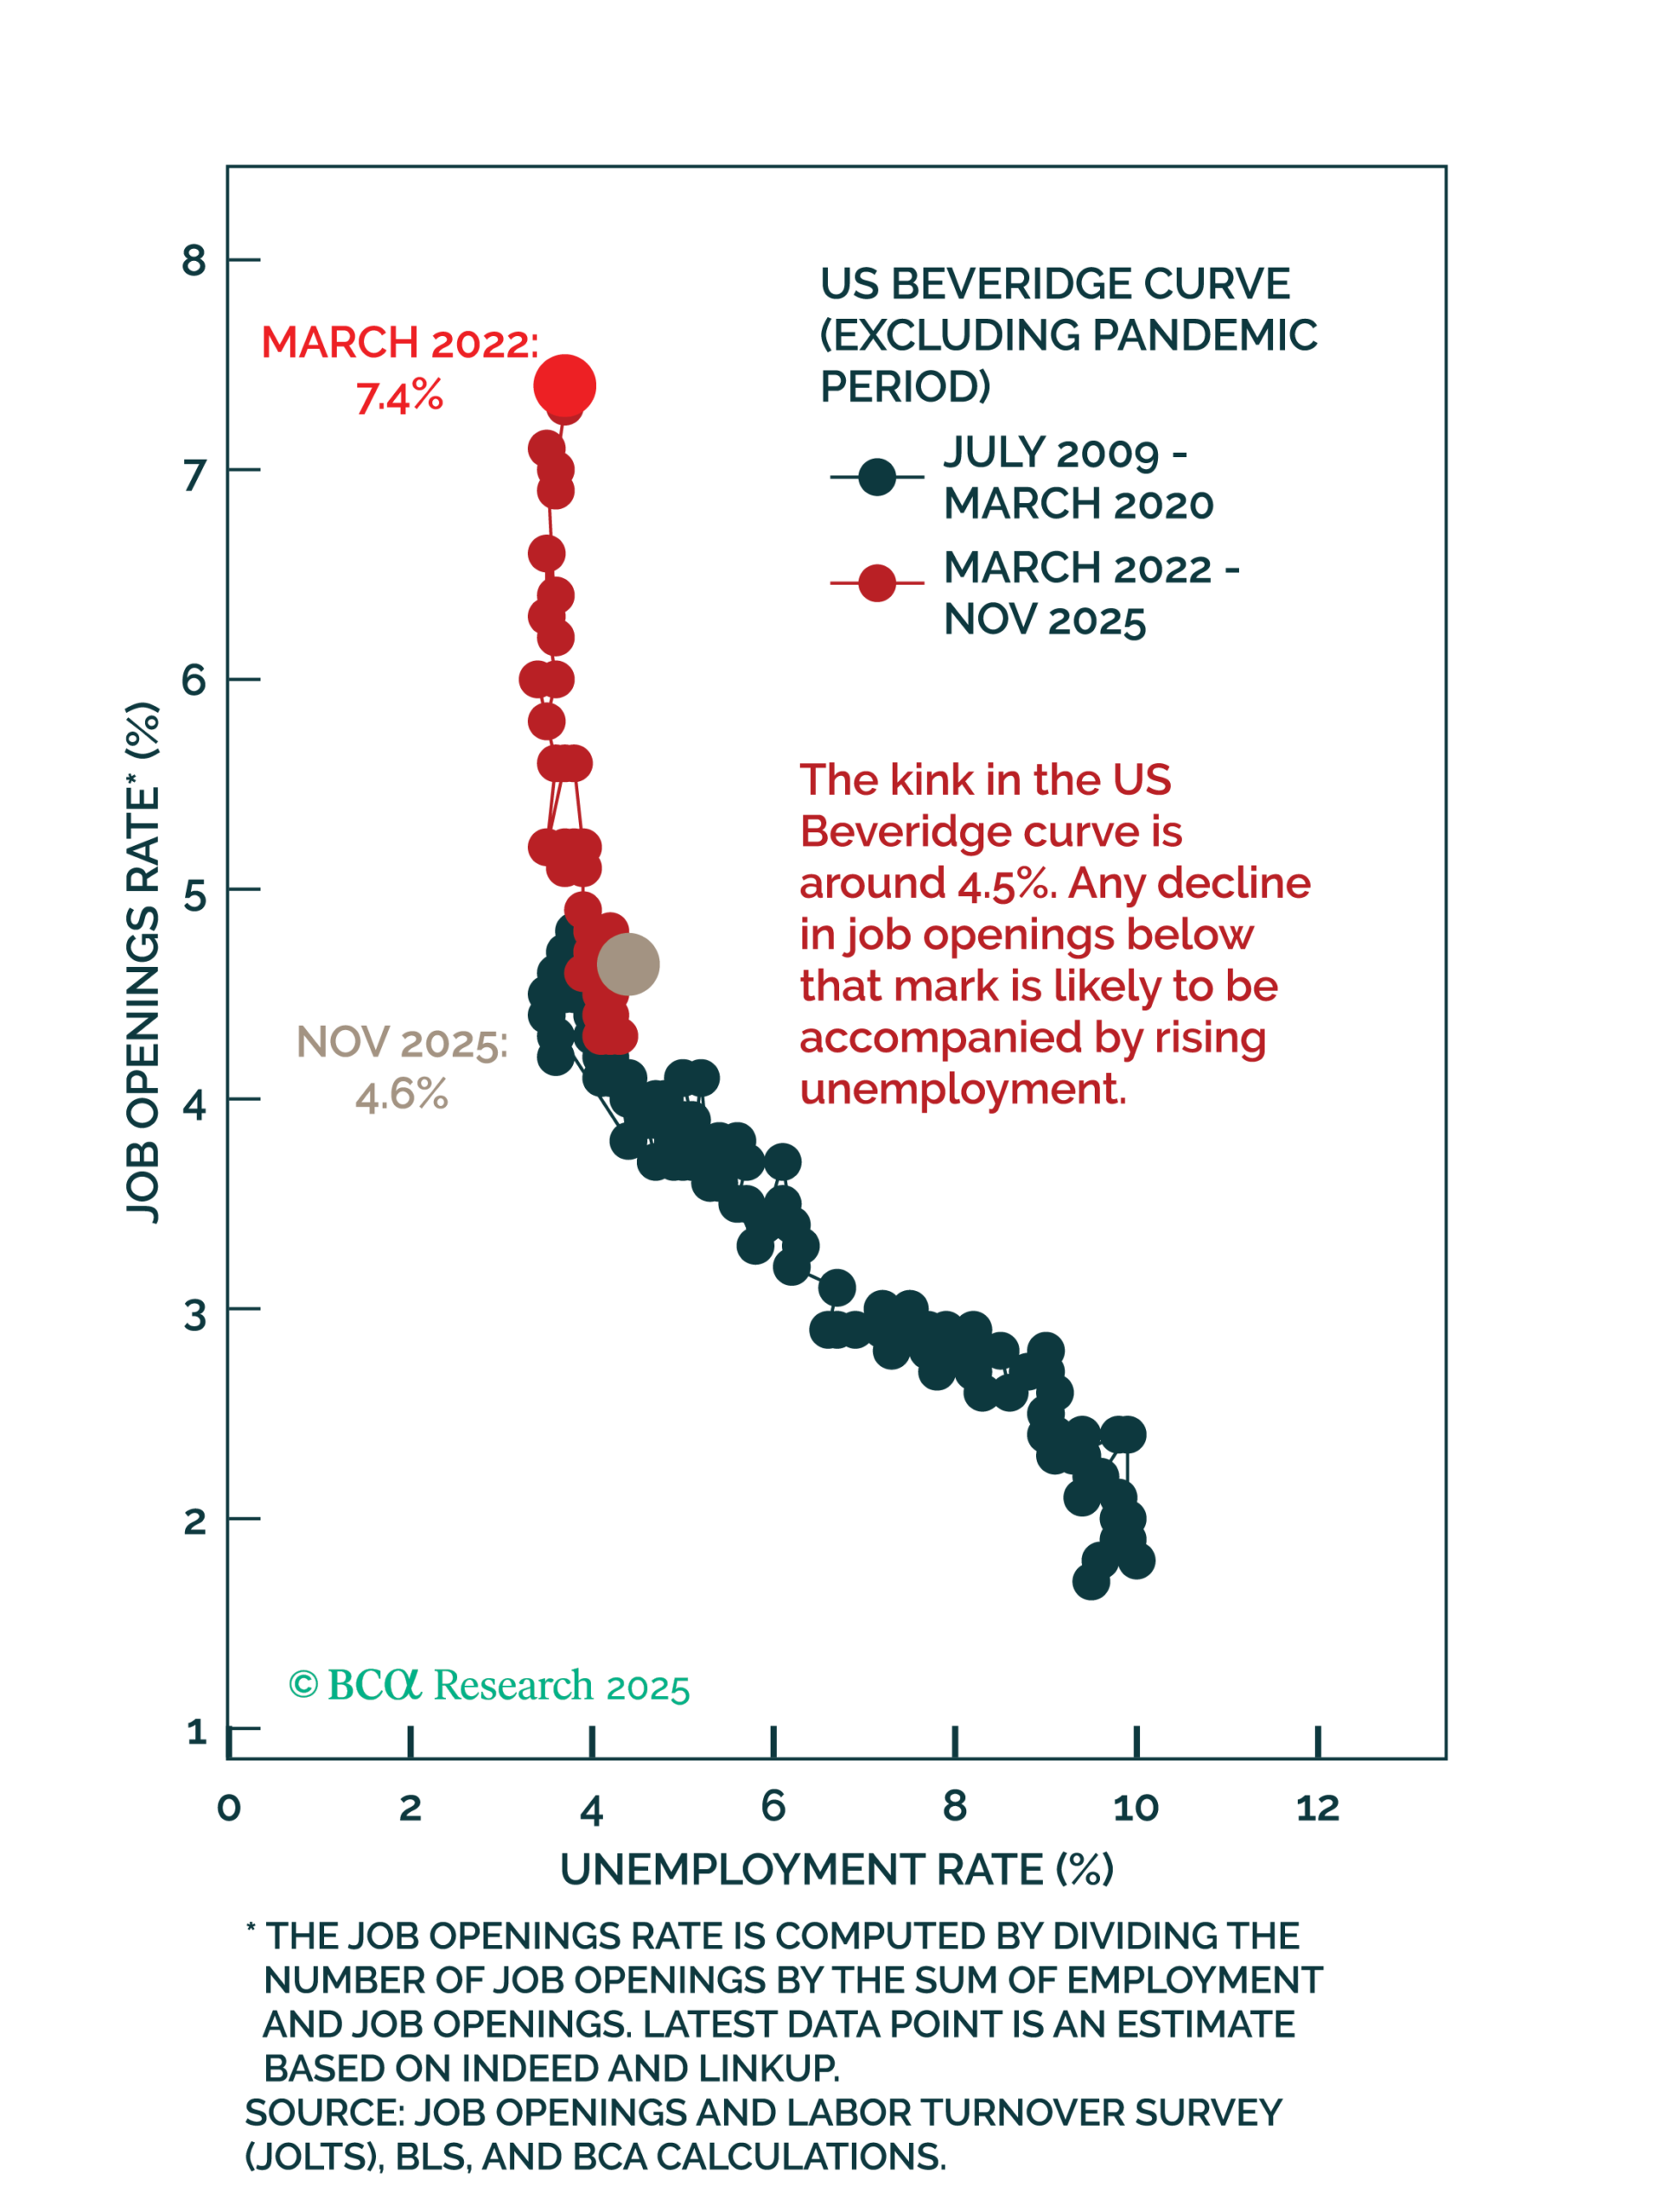
Figure 10 – Any further lull in labour demand in 2026 could amplify unemployment materially
Furthermore, the progressive deceleration in year-over-year payrolls growth, a notable recessionary indictor when falling below 1%, looks to continue. In the first half of 2025, the shortfall was already there, but admittedly narrow. As of November, the payrolls growth gap has broken the threshold materially after tumbling to 0.6%, following a 0.7% print in October and 0.8% in September – see Figure 11.
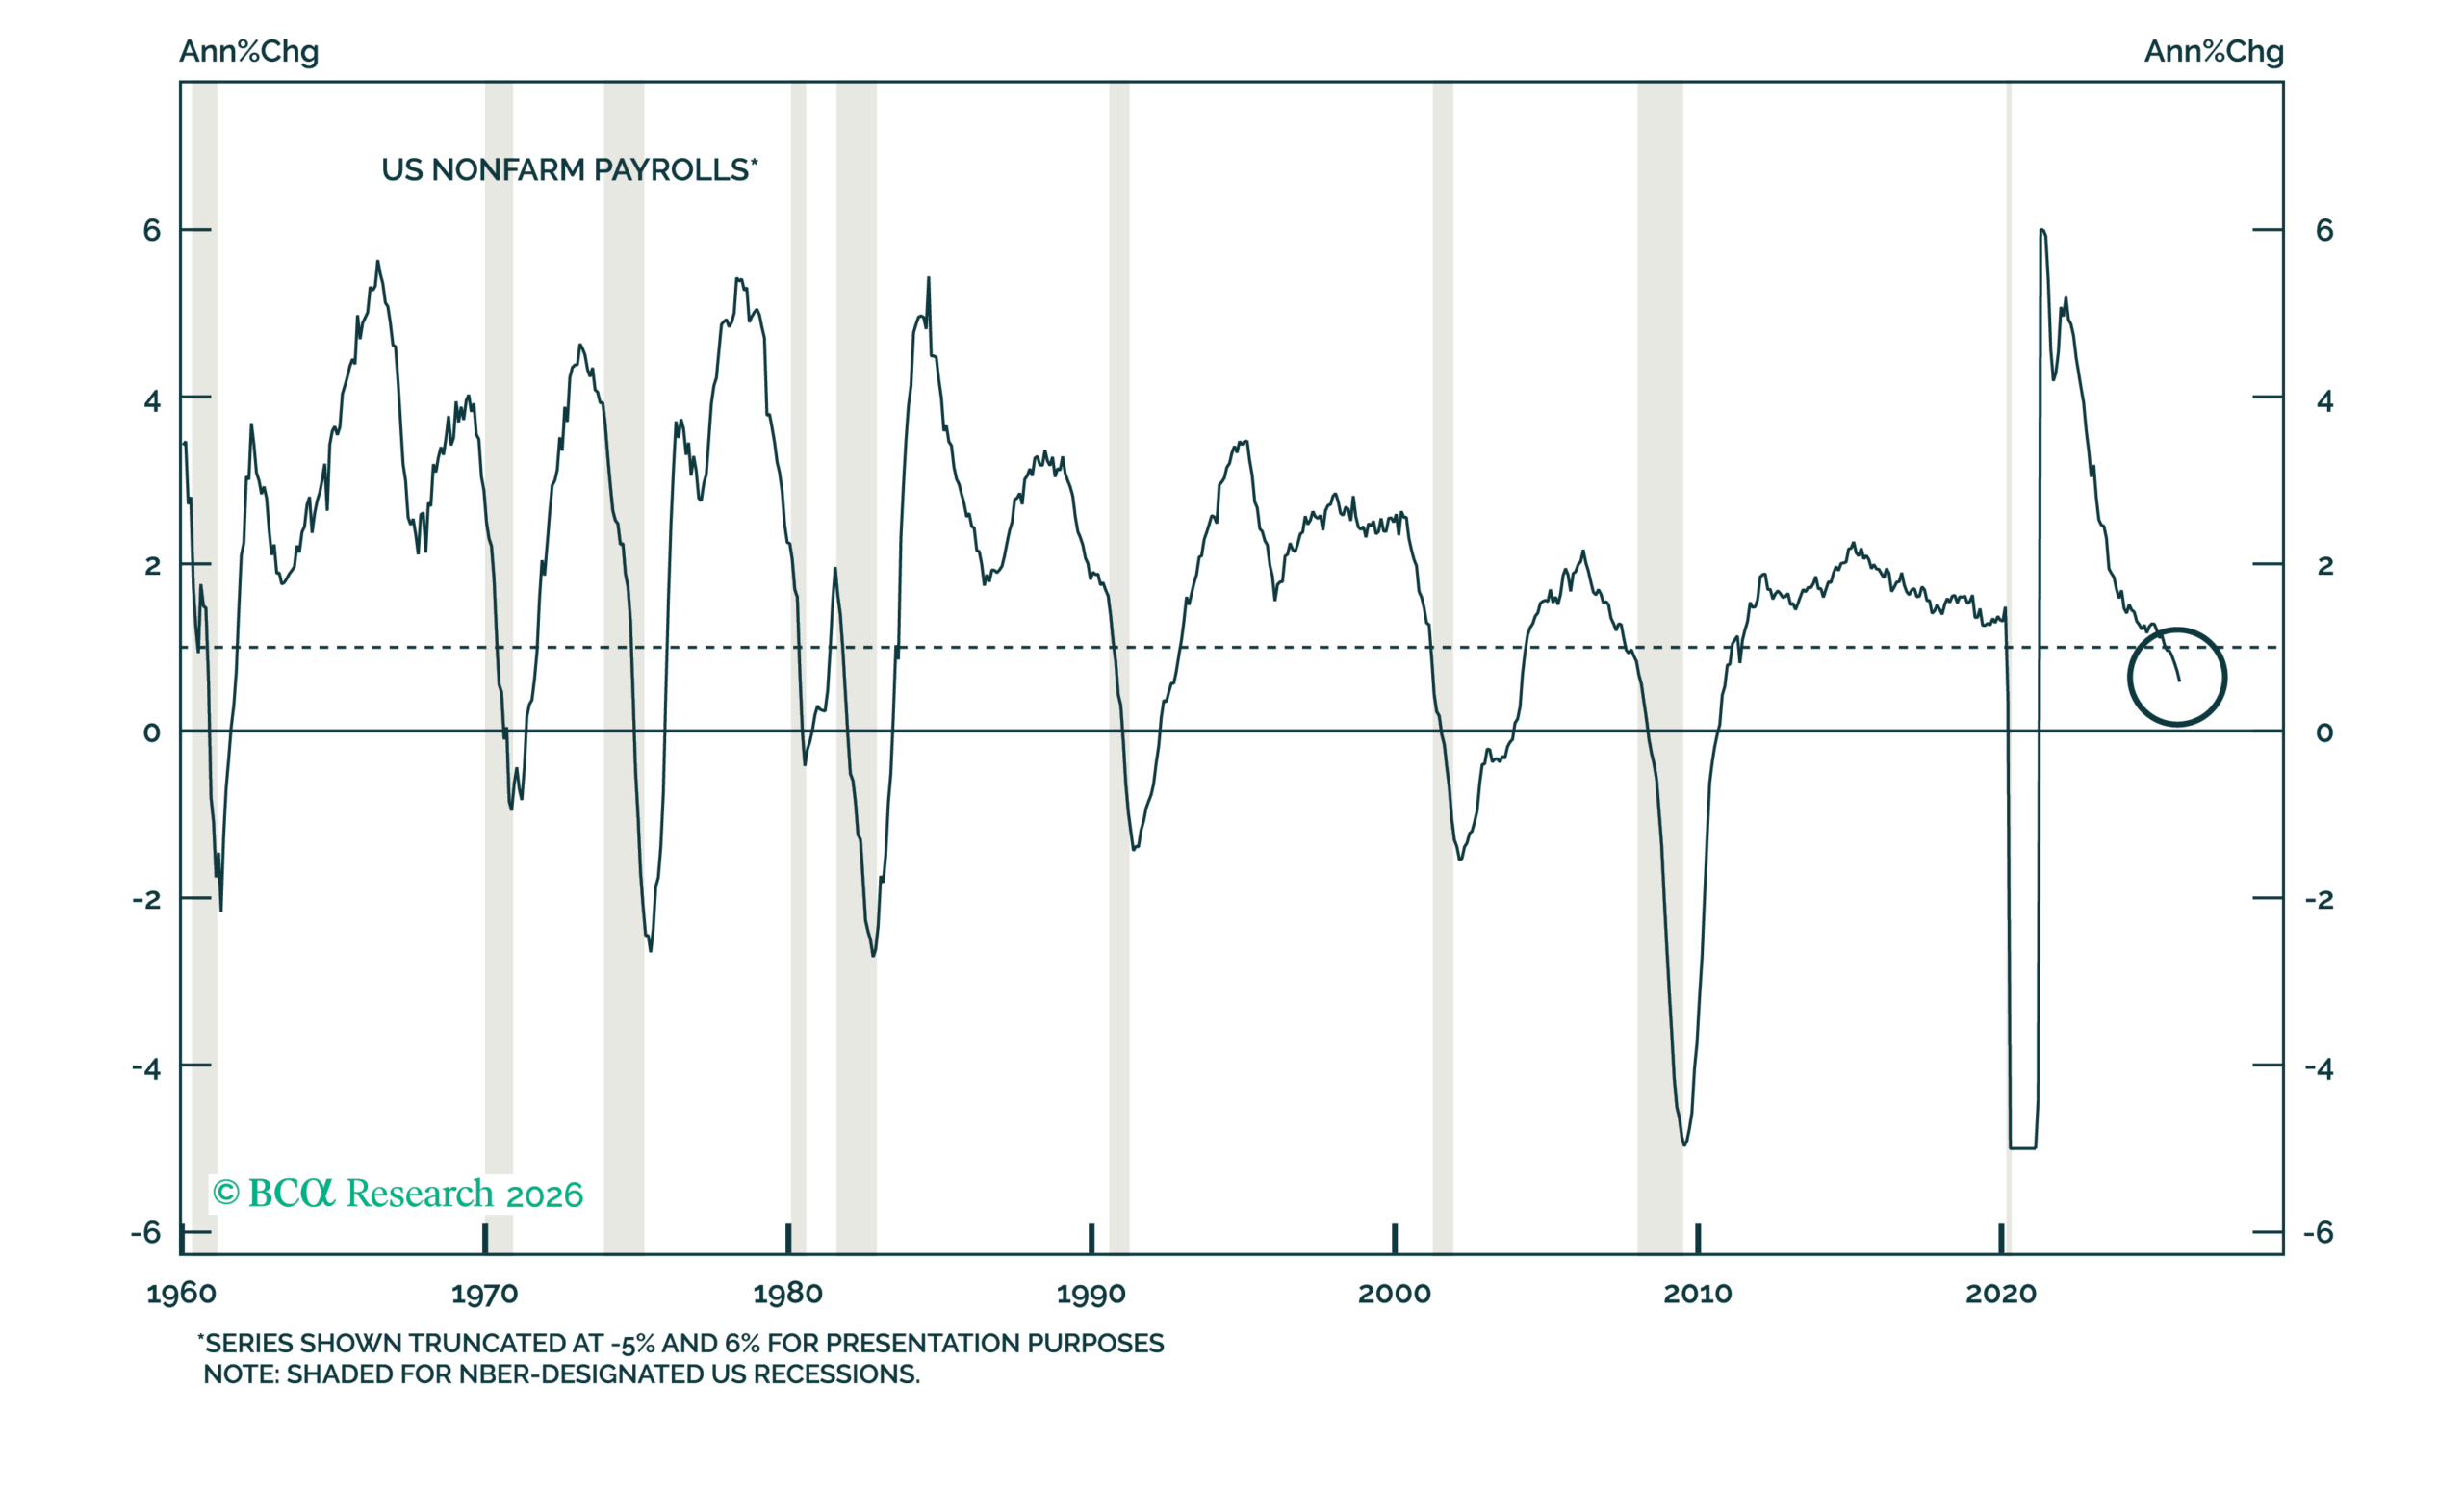
Figure 11 – The 1% leading recessionary indictor has been breached as of H2 2025
The final countdown
Fiscal policy has provided some offset through provisions in the One Big Beautiful Bill Act (“OBBBA”), but these supports have been partially negated by tariff-related drags on households’ purchasing power – see Figure 12. This leaves the broad middle, the consumption swing factor, without any real support going into 2026.
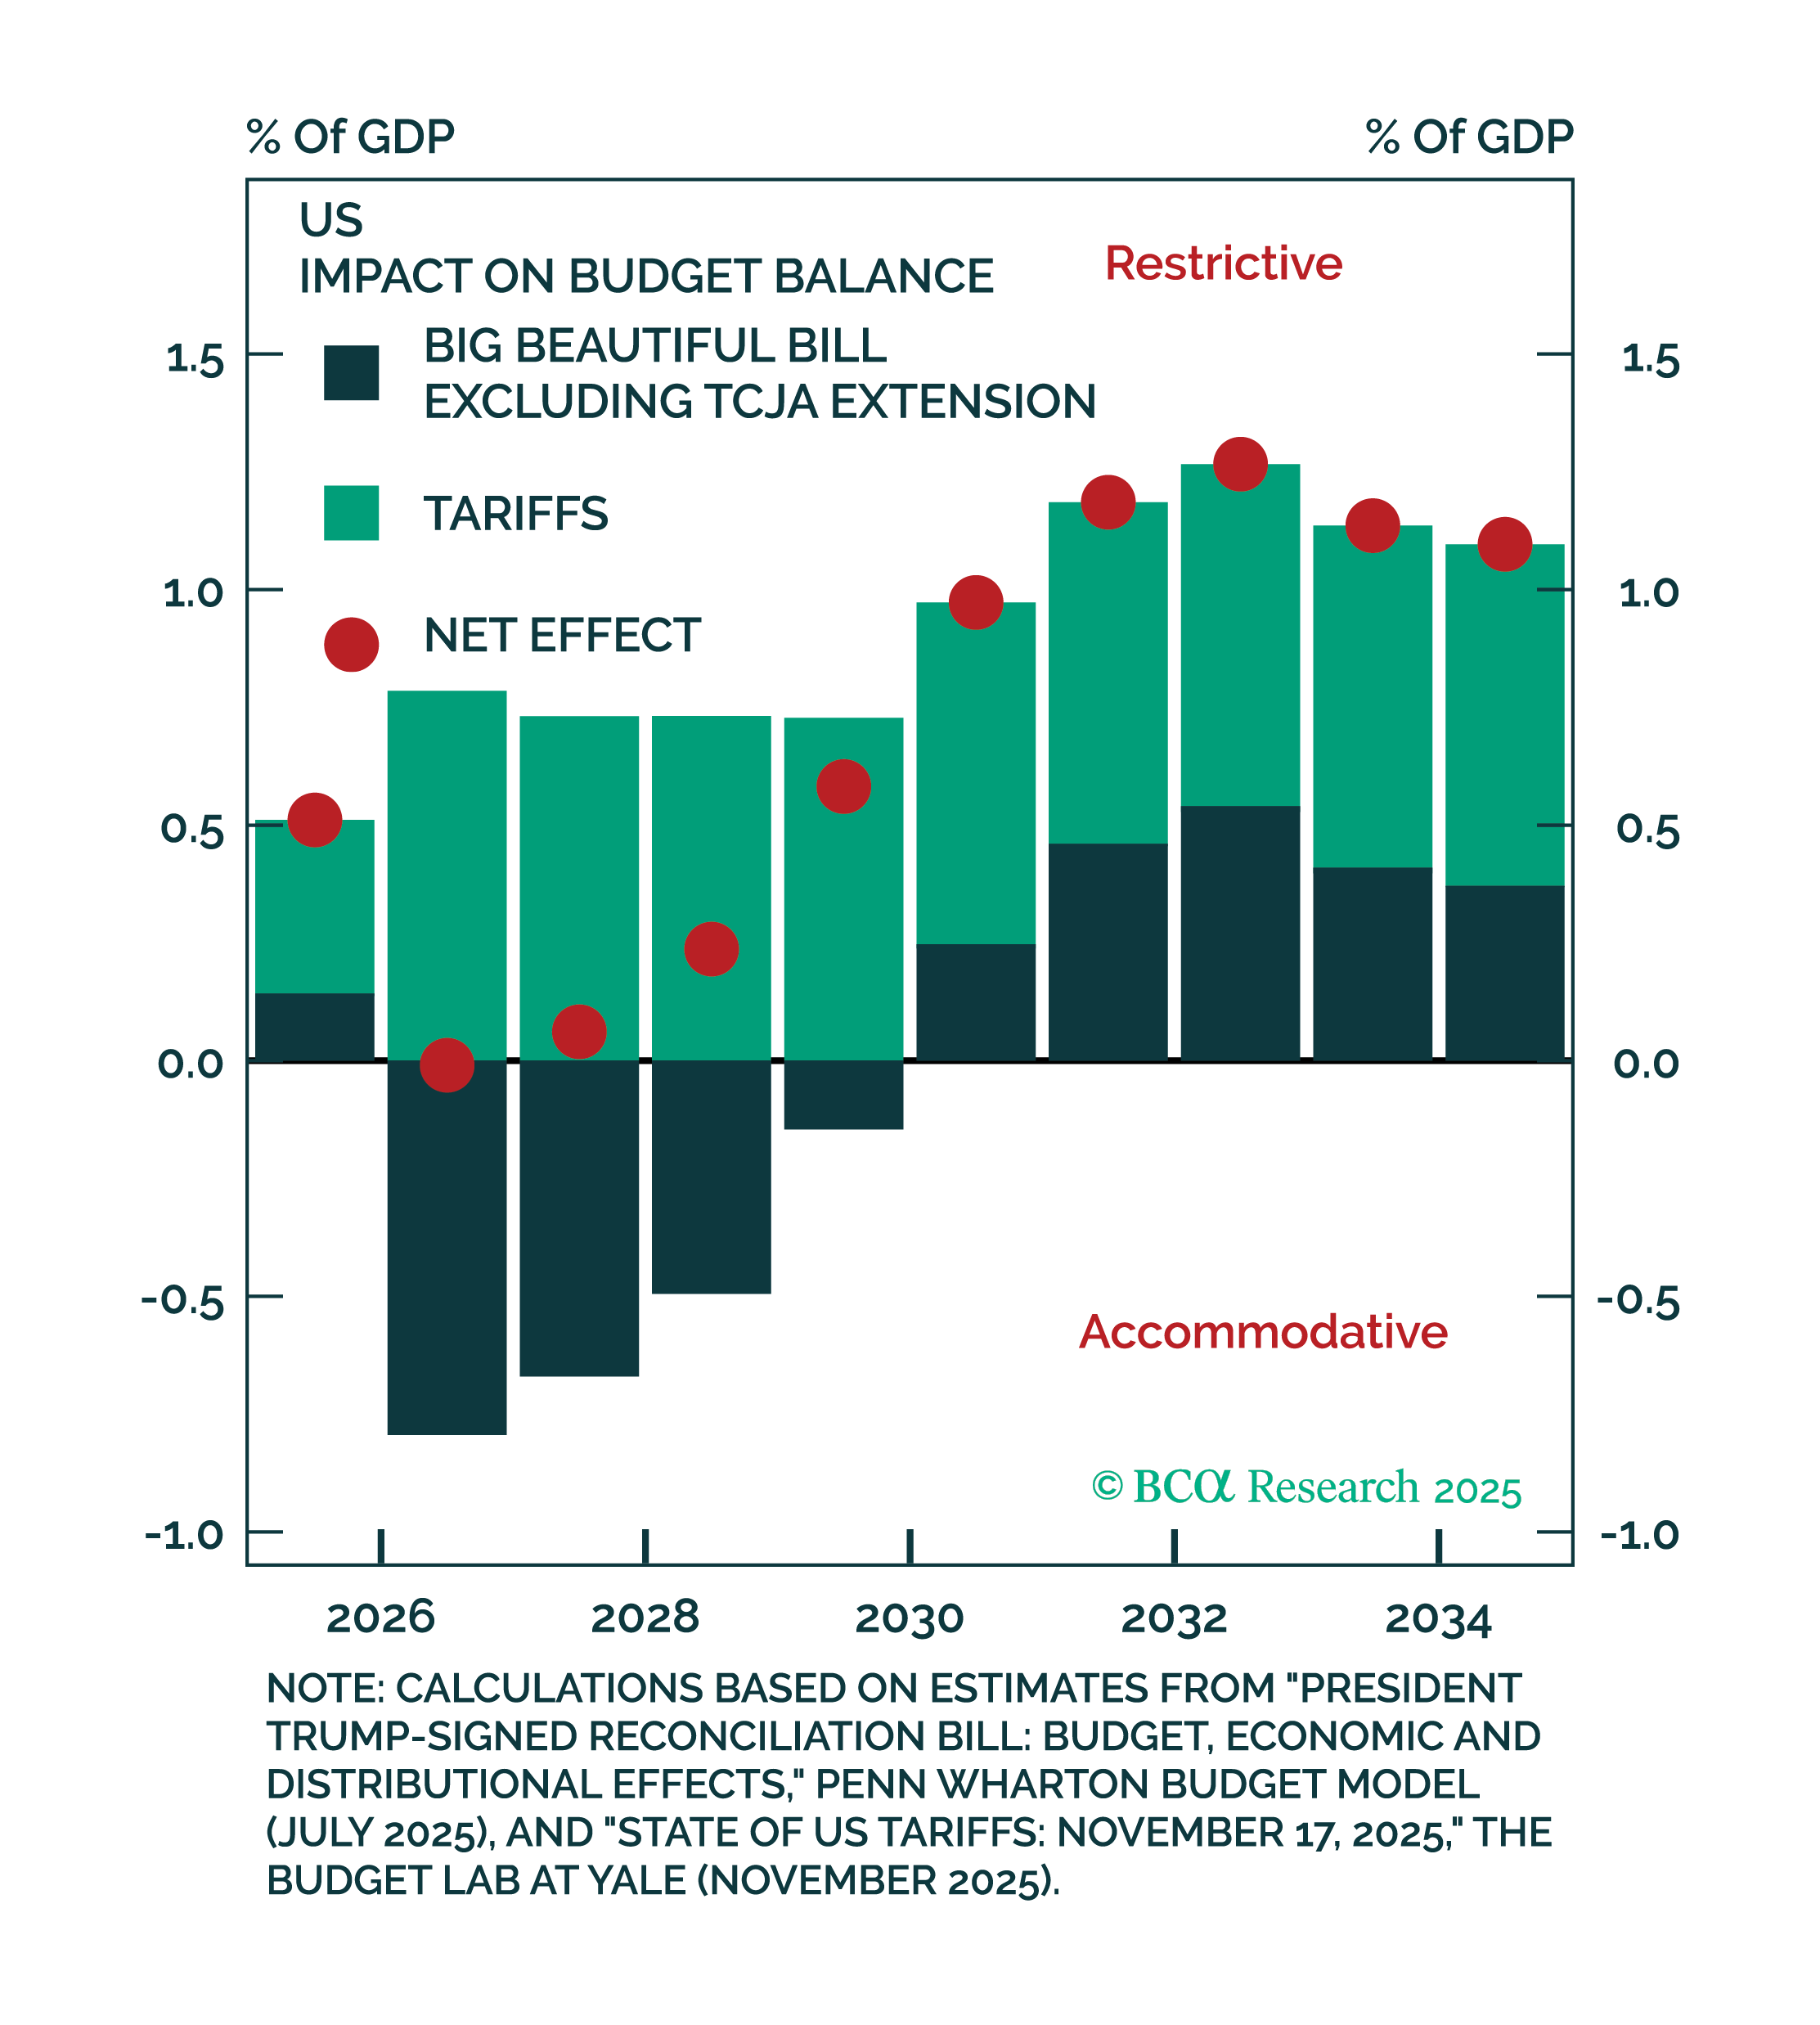
Figure 12 – OBBBA cannot be relied on to provide much fiscal thrust for the average consumer in 2026
Moreover, what policy support does exist has tended to only favour channels that amplify the wealth effects at the top of the income distribution, such as tax incentives for data centre construction and capital investment. Thus, tariffs and cost pressures fall more heavily on households already facing a cost-of-living squeeze, reinforcing the divergence between the upper and lower legs of the K-shaped economy.
Related to the cost-of-living pressures, is the ongoing development in Venezuela since Maduro’s capture. While Trump has asserted his wish of “running the country” and entering with US oil companies, the intervention is unlikely to offer enough meaningful near-term relief to households or equity markets via cheaper energy, at least for 2026. Venezuela’s vast reserves mask the reality that production is already near 900,000 barrels per day and that any material increase would require years of capital, expertise, and institutional repair.
This being said, the asymmetrical benefit of the financial market, and the underlying cost crisis in the real economy together, could create a tension at the core of the 2026 outlook. AI sentiment technically benefits from signs of economic weakness to the extent that it will bring rates lower and support high debt-financed capex. This fuels our earlier mentioned recessionary indictor – see Figure 3.
On the other hand, this same weakening will further undermine household income and consumption, deepening the K-shaped divide. With savings depleted, credit constrained, and labour income under pressure, demand growth could become fragile. Over time, this weak consumption and limited income growth will also add in constraining the realisation of the trillions in revenue assumptions priced by AI valuations. On the cost side, the need to sustain capital intensity to combat an AI innovation plateau, due to an AI winter, will compress short-term profitability and returns, increasing the risk of a later correction.
Investment takeaway
US policy suggests a growing emphasis on sustaining US equity markets for as long as possible, even if this comes at the expense of the underlying economy. All else equal, valuations remain highly sentiment-driven and vulnerable to reverse at a moment’s notice, or to correct more slowly over the next 6-12 months as fundamentals point towards an AI winter. Either outcome risks feeding back into the real economy through a reversal of the wealth effects concentrated in the upper leg of the K-shaped distribution.
In the nearer term, selective non-tech sectors that adopt current-generation AI as a productivity tool may offer pockets of opportunity. However, we expect the outlook for most AI-linked equity valuations to begin walking a tightrope by H2 2026, as the pricing of hopes and dreams by investors eventually meet the real cracks of the economy. In expectation of a breakdown in consumption, defensive and non-discretionary companies could still prove a relatively resilient choice, while still enjoying an equity premium in the interim.
If you are interested in finding out more about how cognisance of the macroeconomic backdrop impacts our investment decision making process, connect with Integrity Asset Management and let us help you navigate your investing journey.
For more information on this synopsis or to discuss solutions provided by Integrity Asset Management, please contact us at:
Tel: (021) 671 2112
Cell: 072 513 2684 / 084 601 1025
E-mail: nic@integrityam.co.za / herman@integrityam.co.za
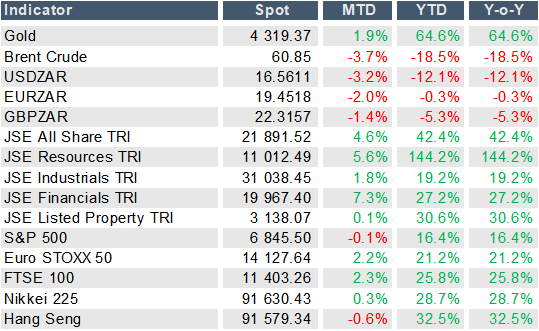
Source: Bloomberg, 31 December 2025