
A 2-year retrospective on the US
Halfway through 2024, the 3-month average of the US unemployment rate rose 50 basis points above its 12-month low, triggering the Sahm rule. Post-1970 this breach has always, without fail, led to an eventual recession. Fast forward to the end of the first half of 2026, this doomsday indicator appears to have potentially rung its first false alarm – see Figure 1.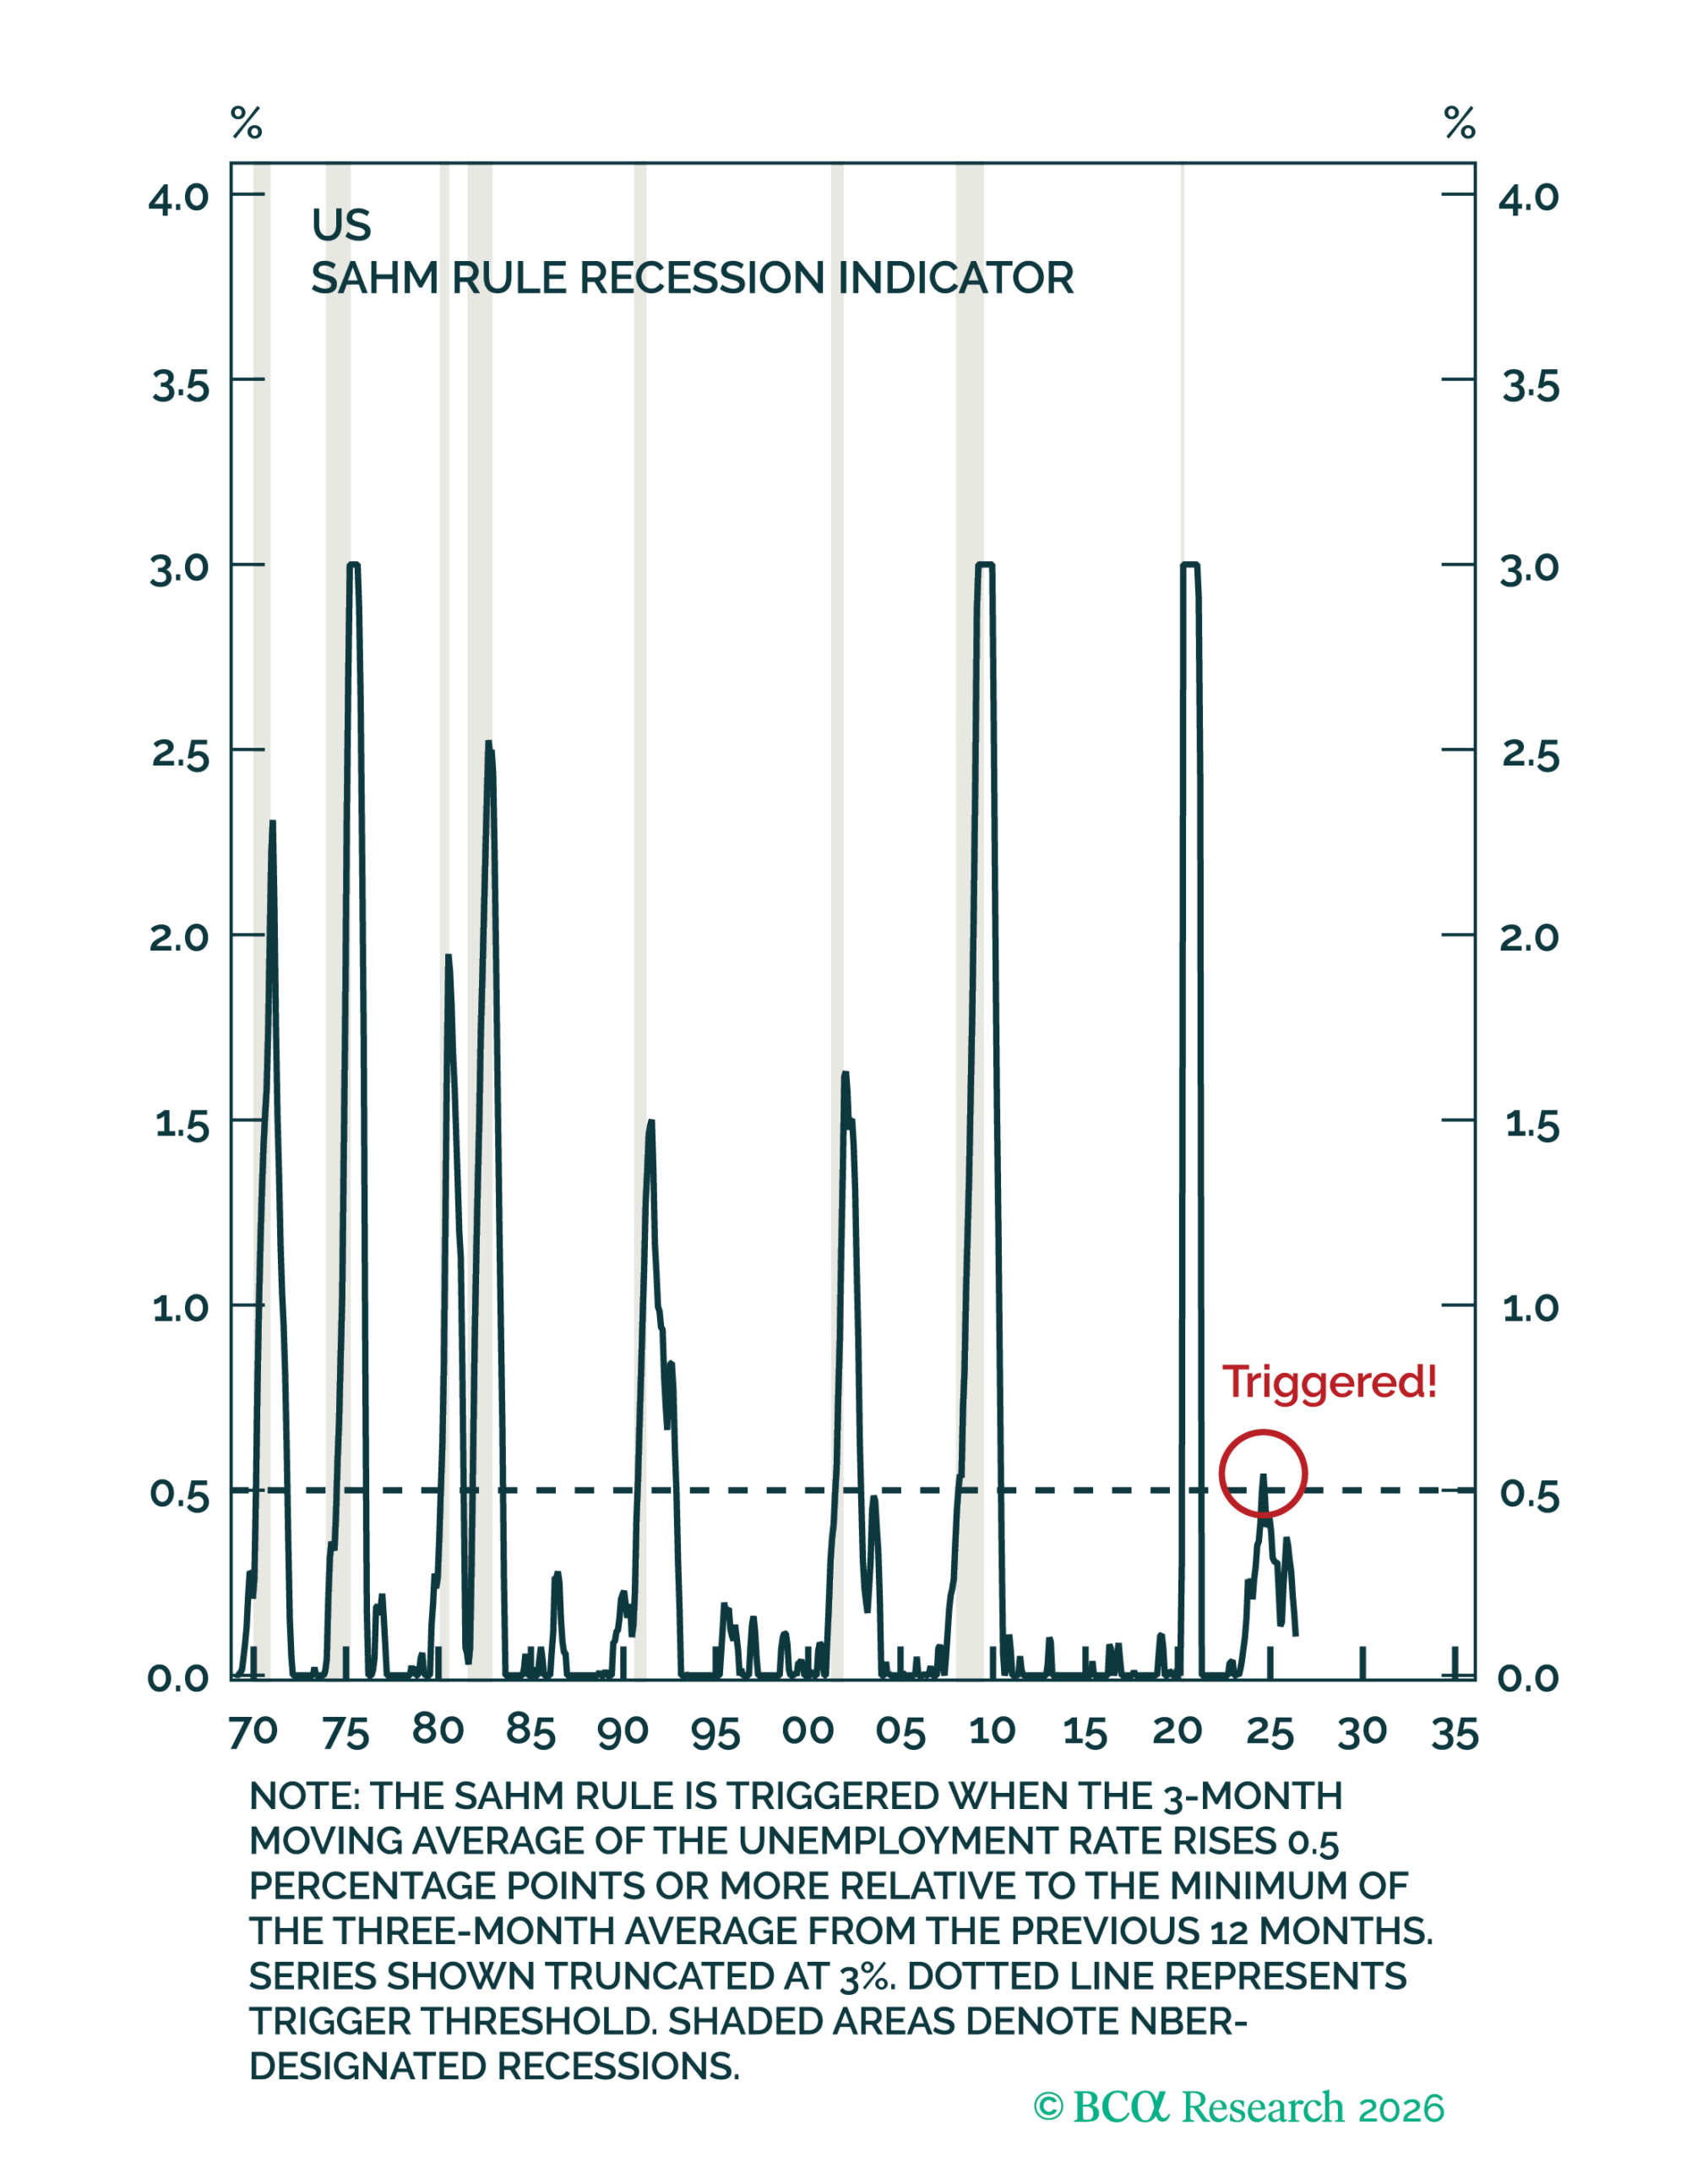
Figure 1 – A false alarm
There are two prevailing arguments for how this soft landing was achieved. For one, a well-timed cut cycle initiated by the Federal Reserve (“Fed”) in late 2024 lent a helping hand. If we consider the second argument, then the initiated cut cycle may have just been a mere facilitator for the true reason: the relentless and exogenous regime of the AI boom.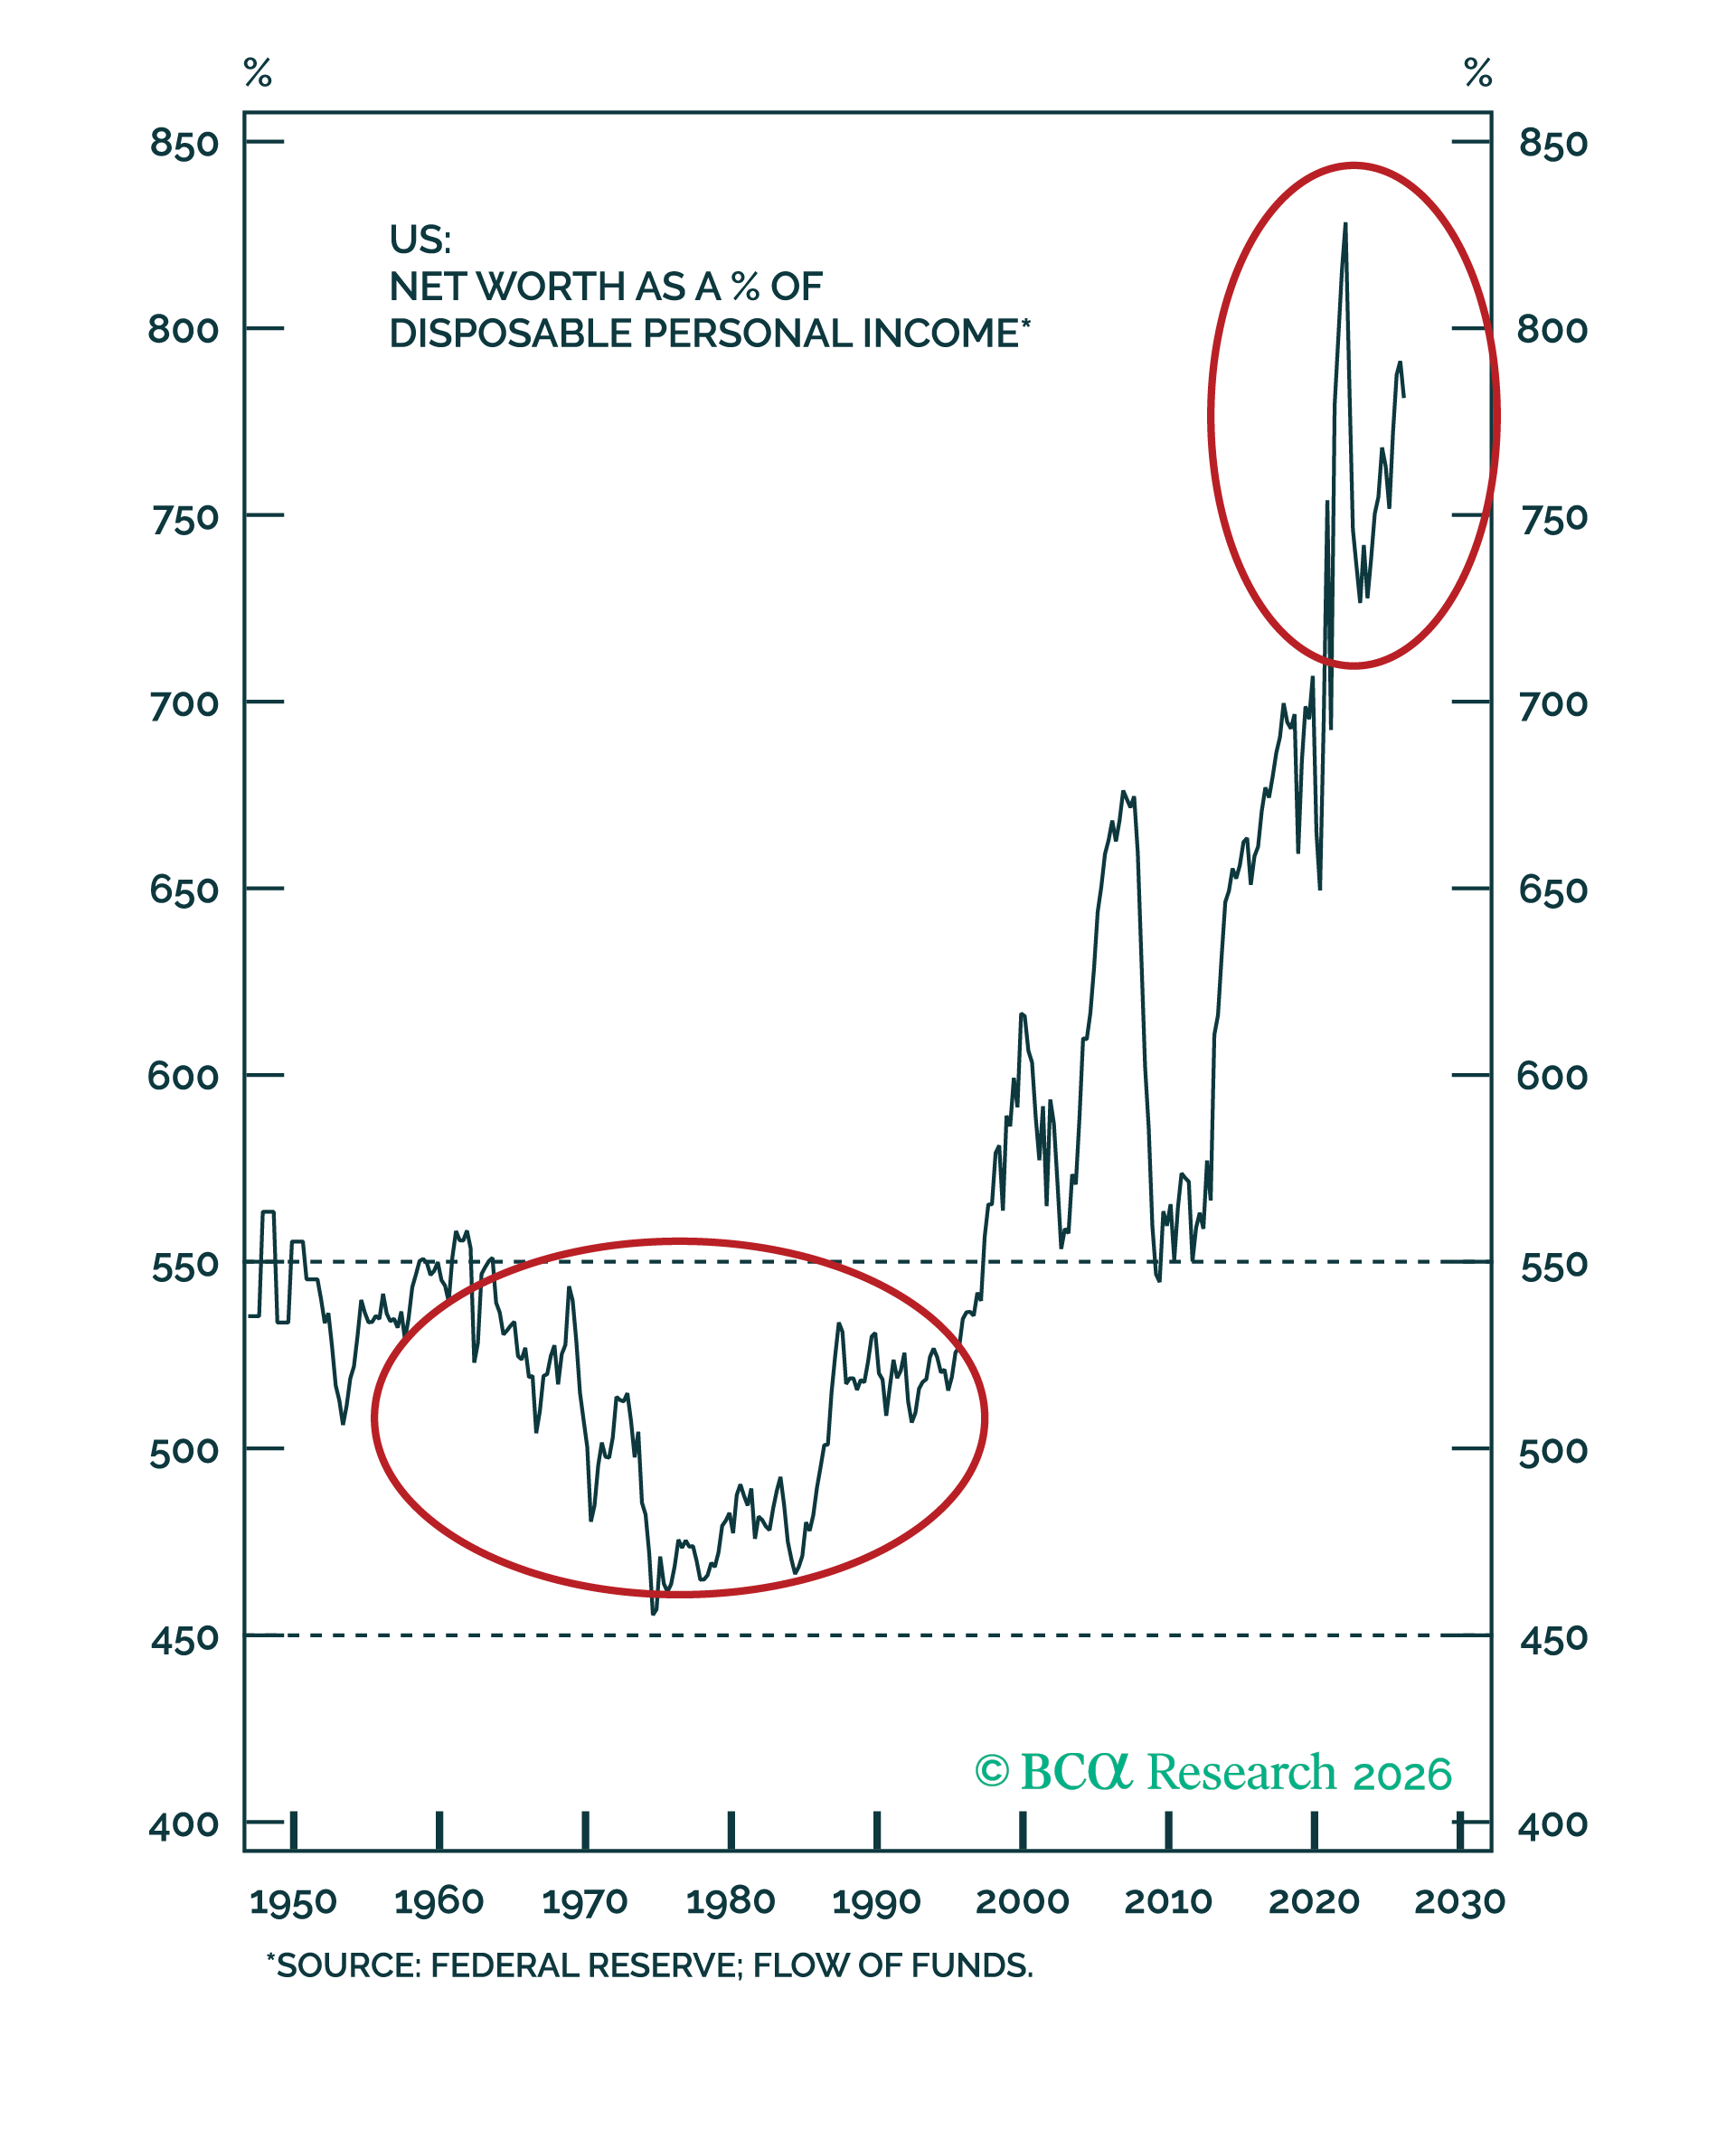
Figure 2 – Today, financial wealth is becoming a far more important support for consumption habits than income
Investment spending kept GDP growth robust on the headline, but the underlying economy logically did not recover overnight from its initial Sahm trigger. Over the last two and half years roughly, the rise in AI-linked shares helped boost US households’ equity holdings by an additional $29 trillion. However, around 50% of US equity wealth is held by the richest 1% of households. Per Moody’s calculations, real spending among the top 20% of highest-earning households grew 4.5% in real terms over the last three years, but contracted 0.6% for the bottom 80%.This reflects the fact that per marginal propensity to consume (“MPC”) dynamics across wealth classes, the accrued equity wealth from this AI bull market has so far not had any meaningful effect on consumption activity by non-affluent households. If viewed under a more pessimistic lens: The recent equity boom may have been the only thing offsetting the slowing income growth for the average household, and keeping their aggregate consumption from falling off a cliff. Supporting this view, the ratio of household net worth to disposable income remains several multiples above its historical average – see Figure 2. On the aggregate, US consumption may have become effectively tied to equity returns since 2020.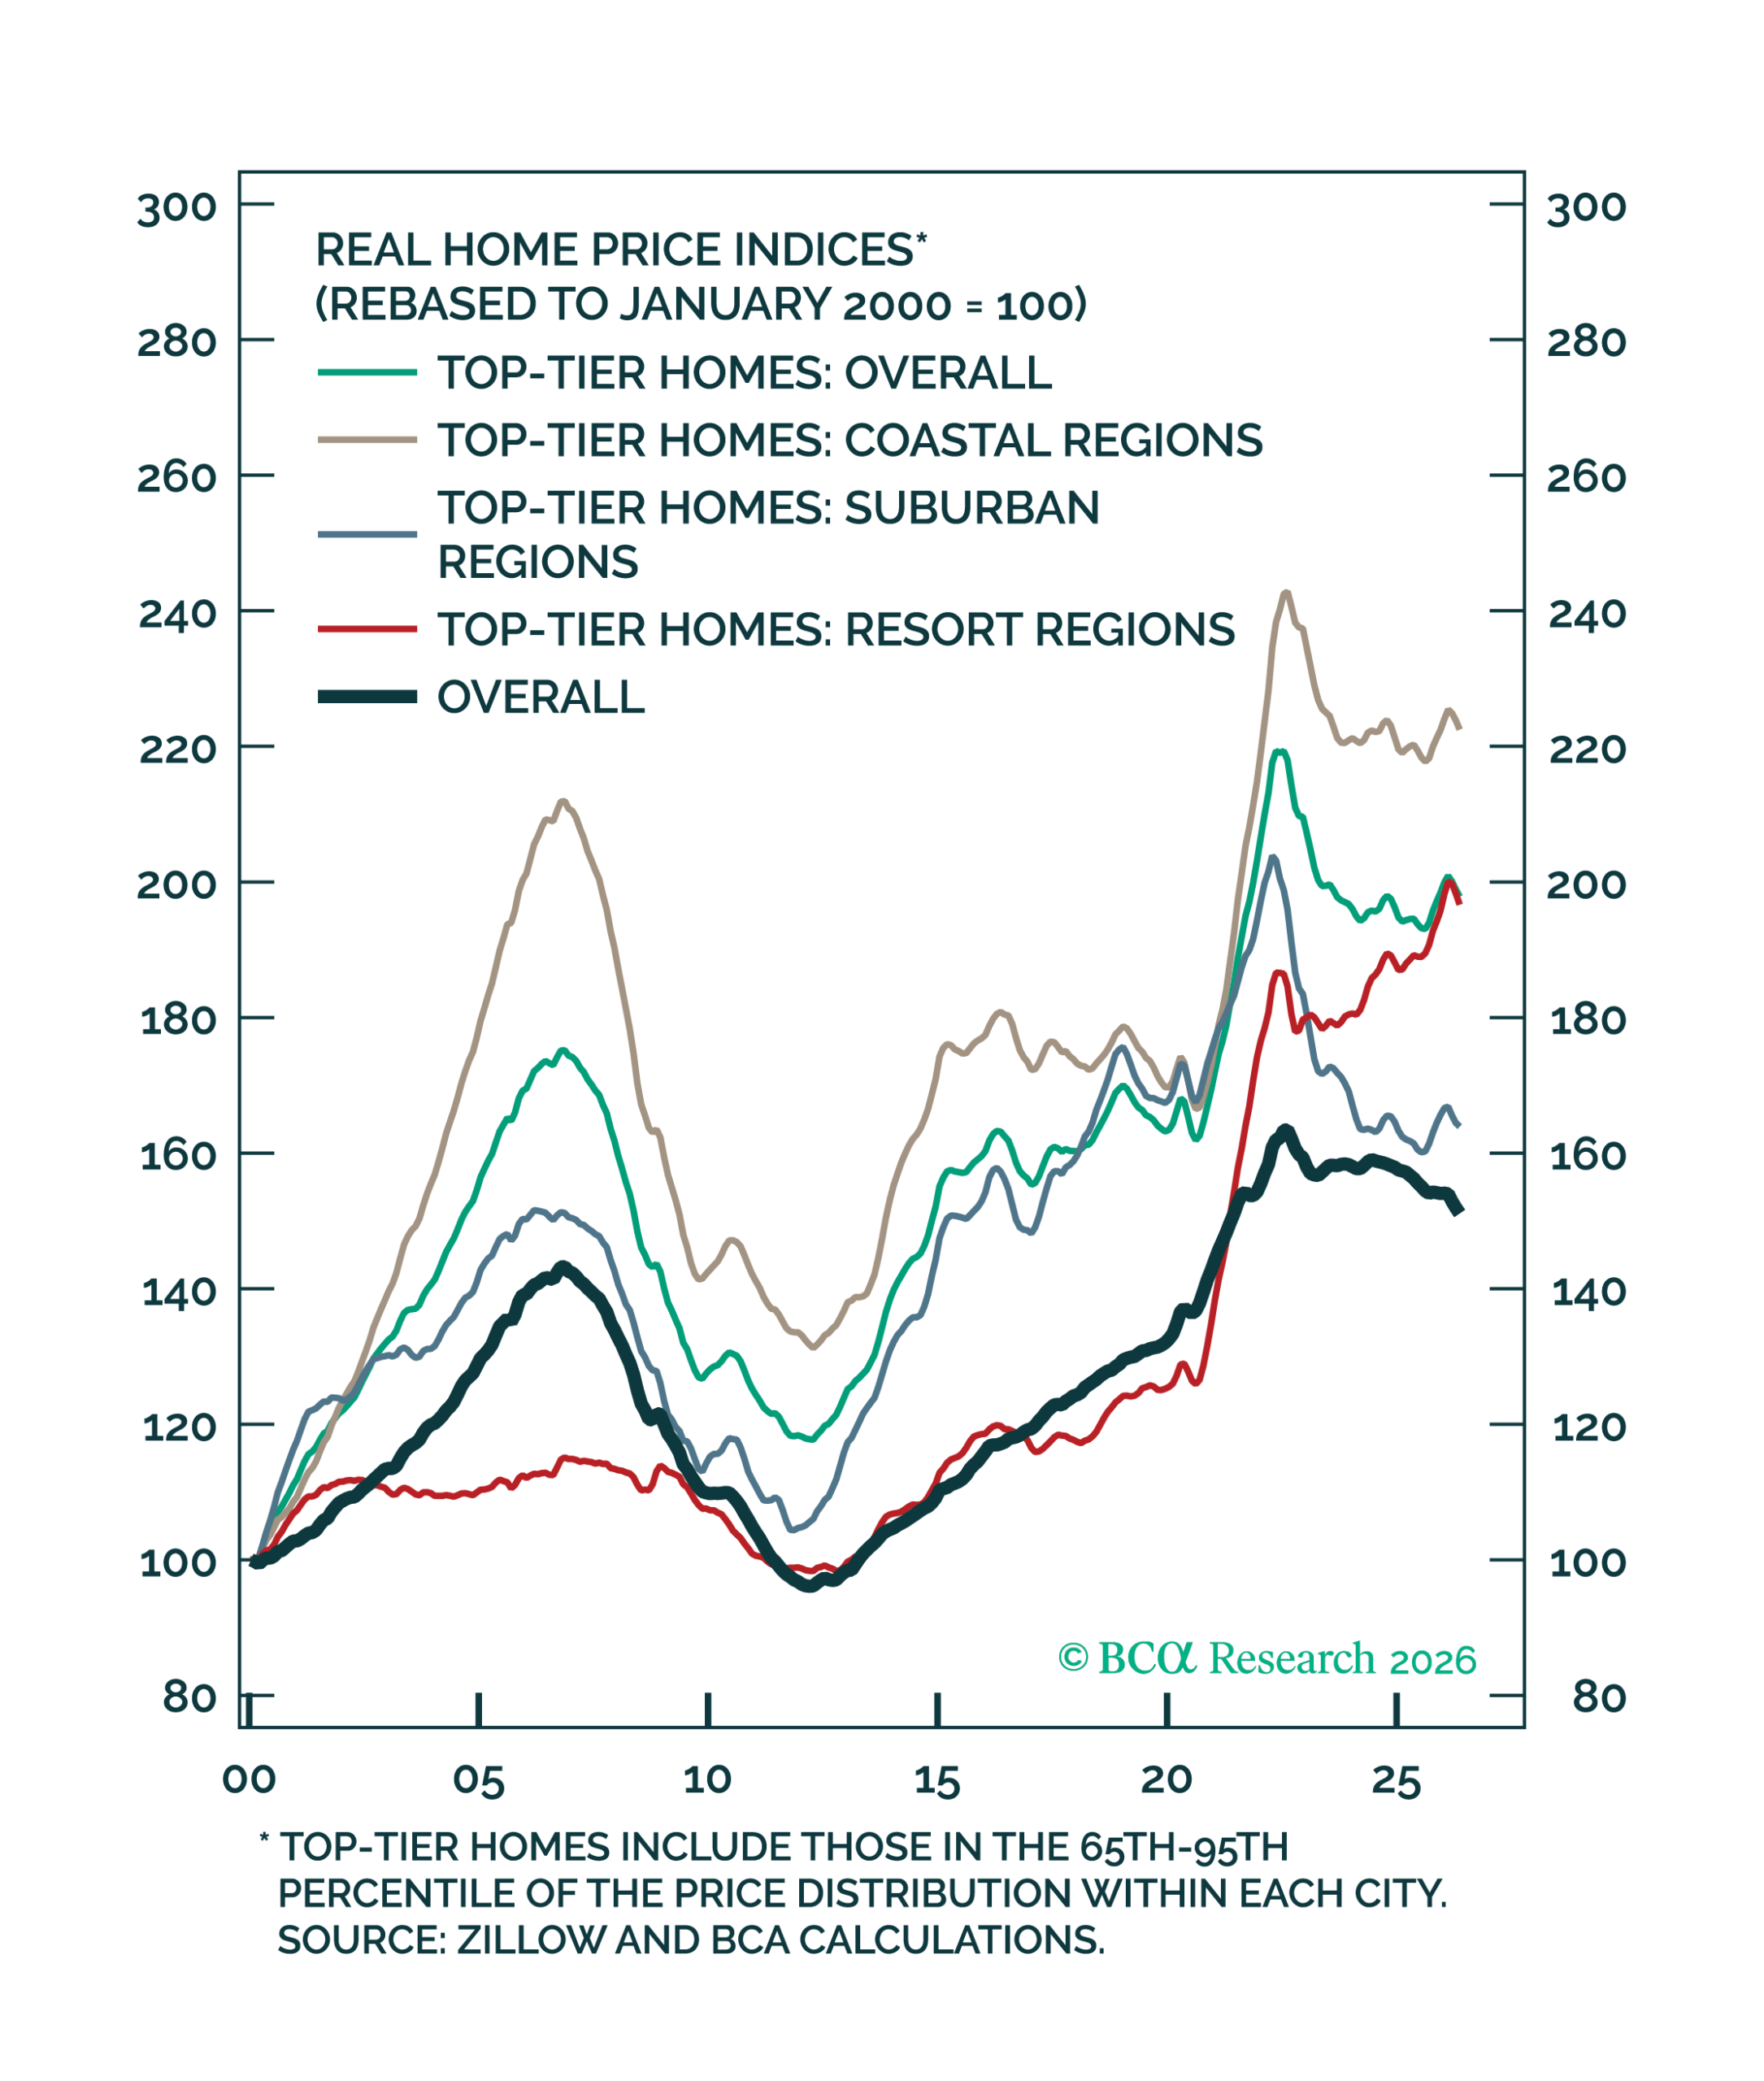
Figure 3 – Housing in affluent areas have wholly avoided the curse of the otherwise flat returns of the sector
The above points summarise the key setup that has created a heavily diverged K-shaped economy, the trending economic topic since late 2025. The divergence of wealth has not been isolated to financial asset wealth, as even the housing market is displaying this pattern. Adjusted for inflation, US home prices have been broadly flat since mid-2021, but that aggregate masks a clear divergence. Consistent with a K-shaped pattern, property values in higher-income areas have outperformed those in lower-income regions – see Figure 3.
A bang, pursued by a whimper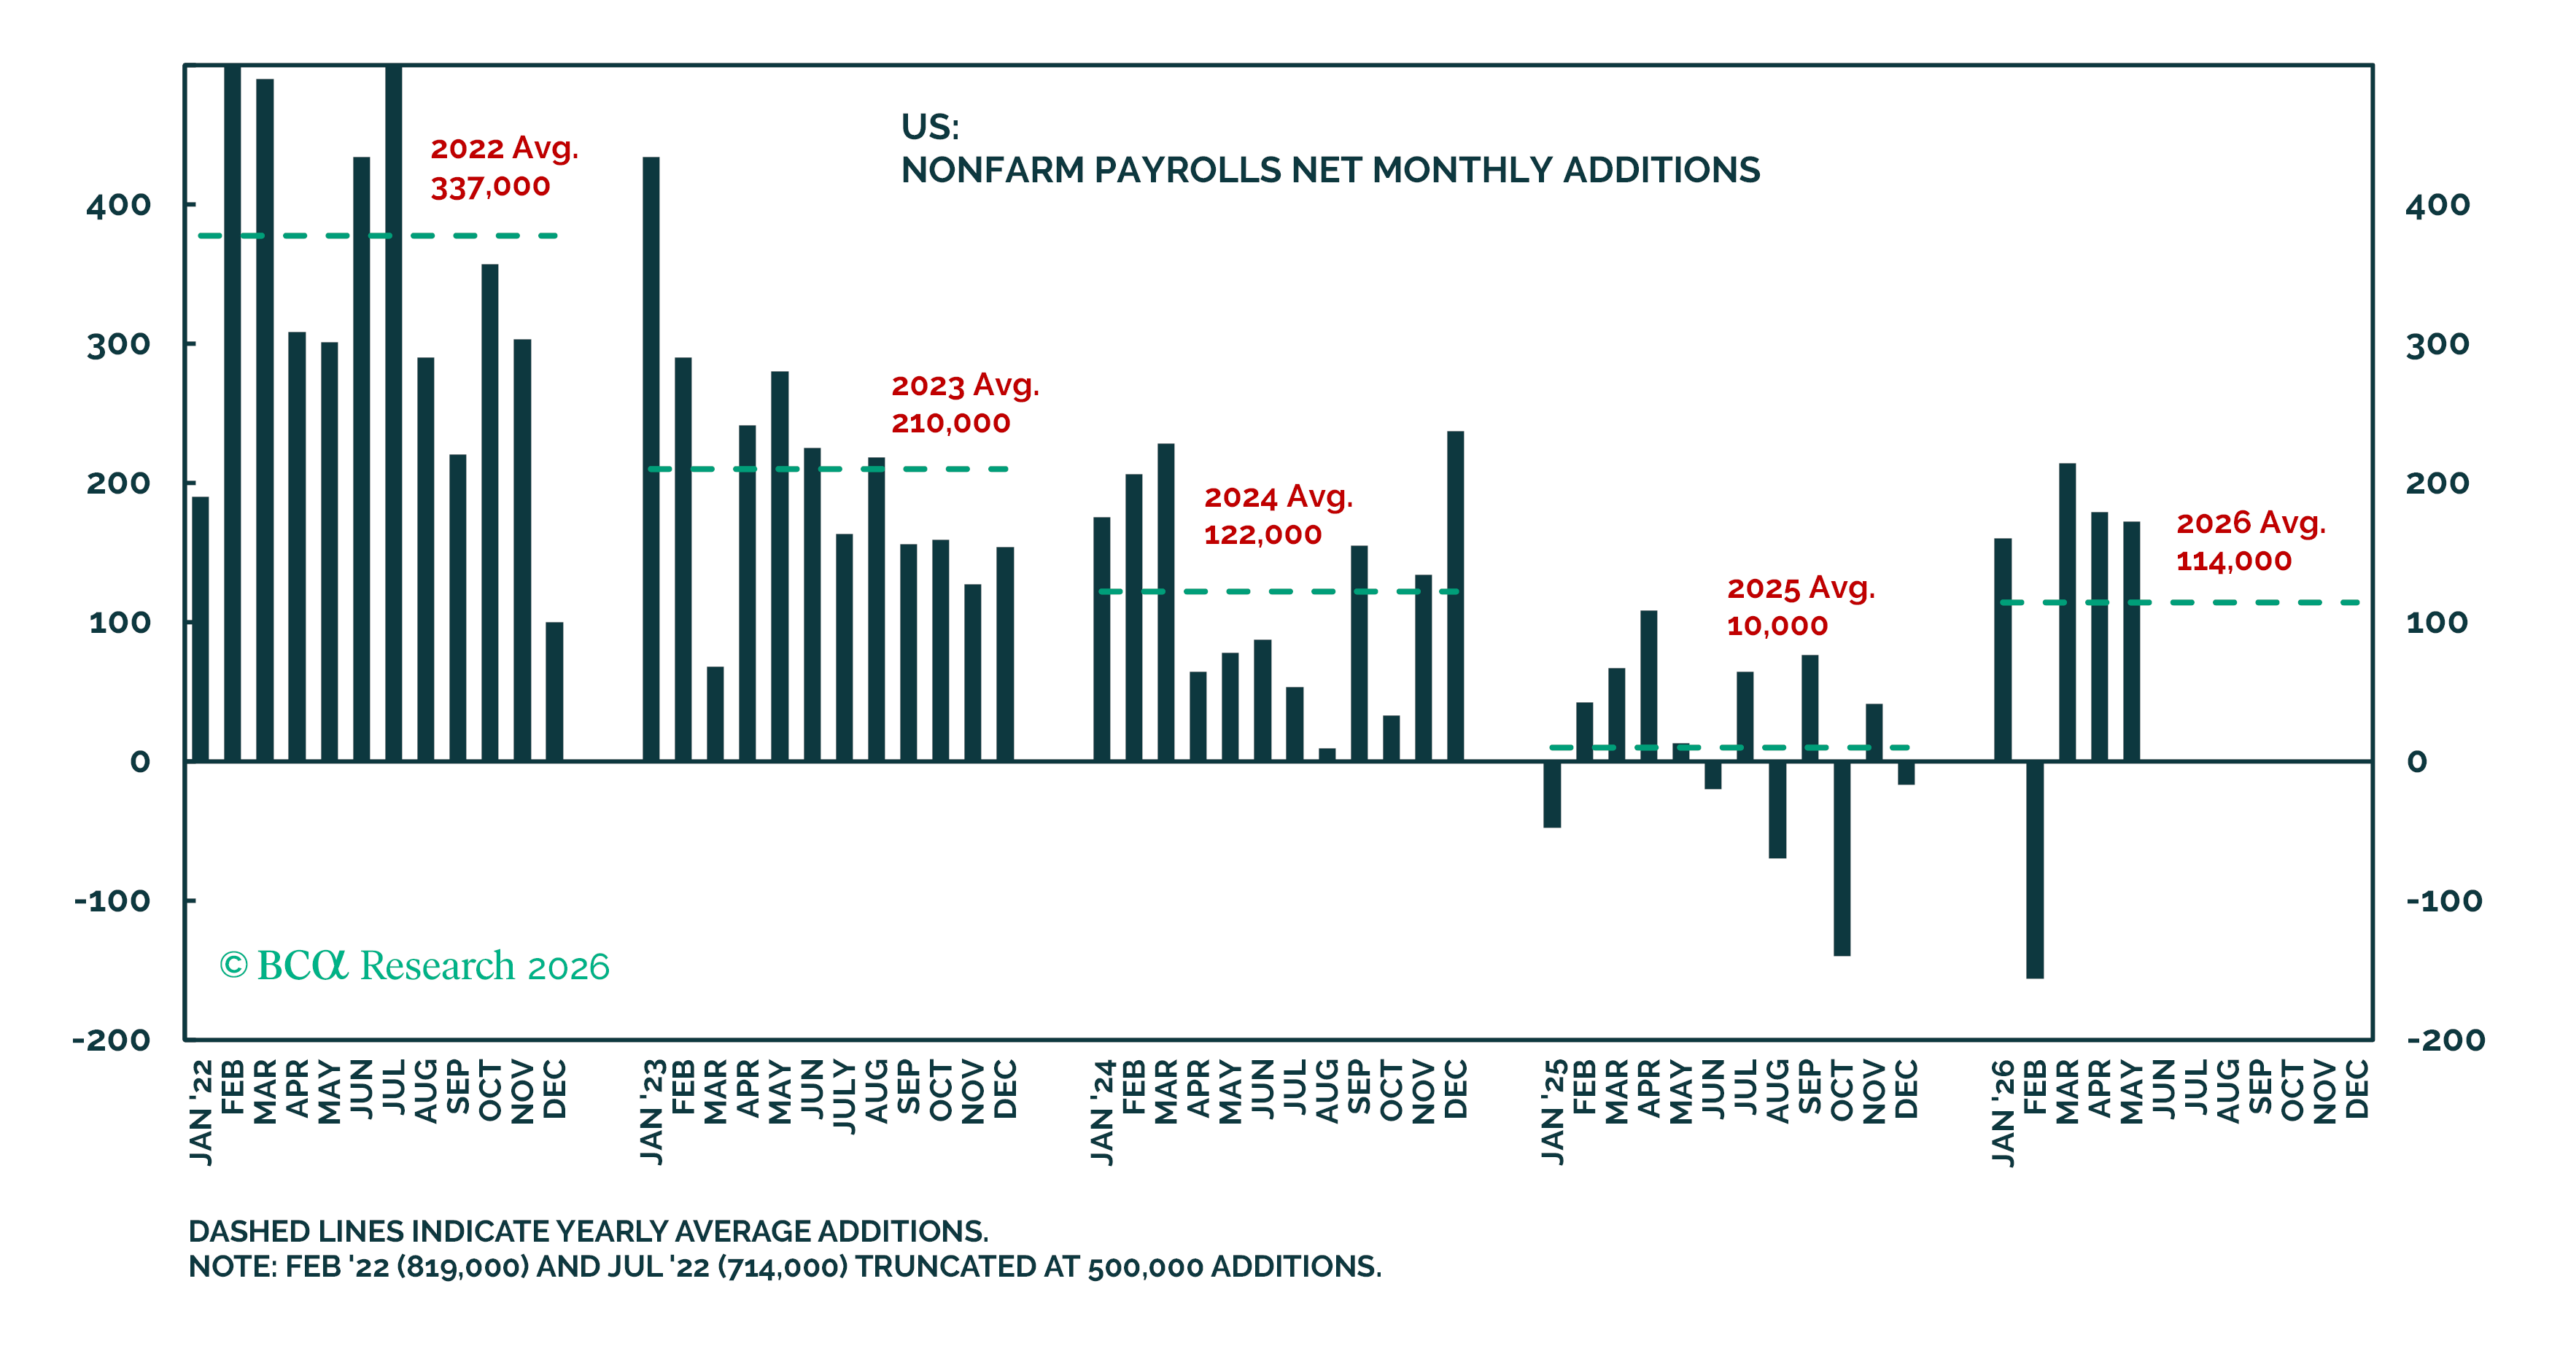
Figure 4 – The labour market has been recovering in 2026 so far
The pressured labour market remained one of the sticky pieces of evidence that the breach of the Sahm rule would eventually come home to roost. The average net monthly addition in Nonfarm Payrolls (“NFP”) for 2025 was 10,000, having plummeted since 2022’s 337,000 average – see Figure 4.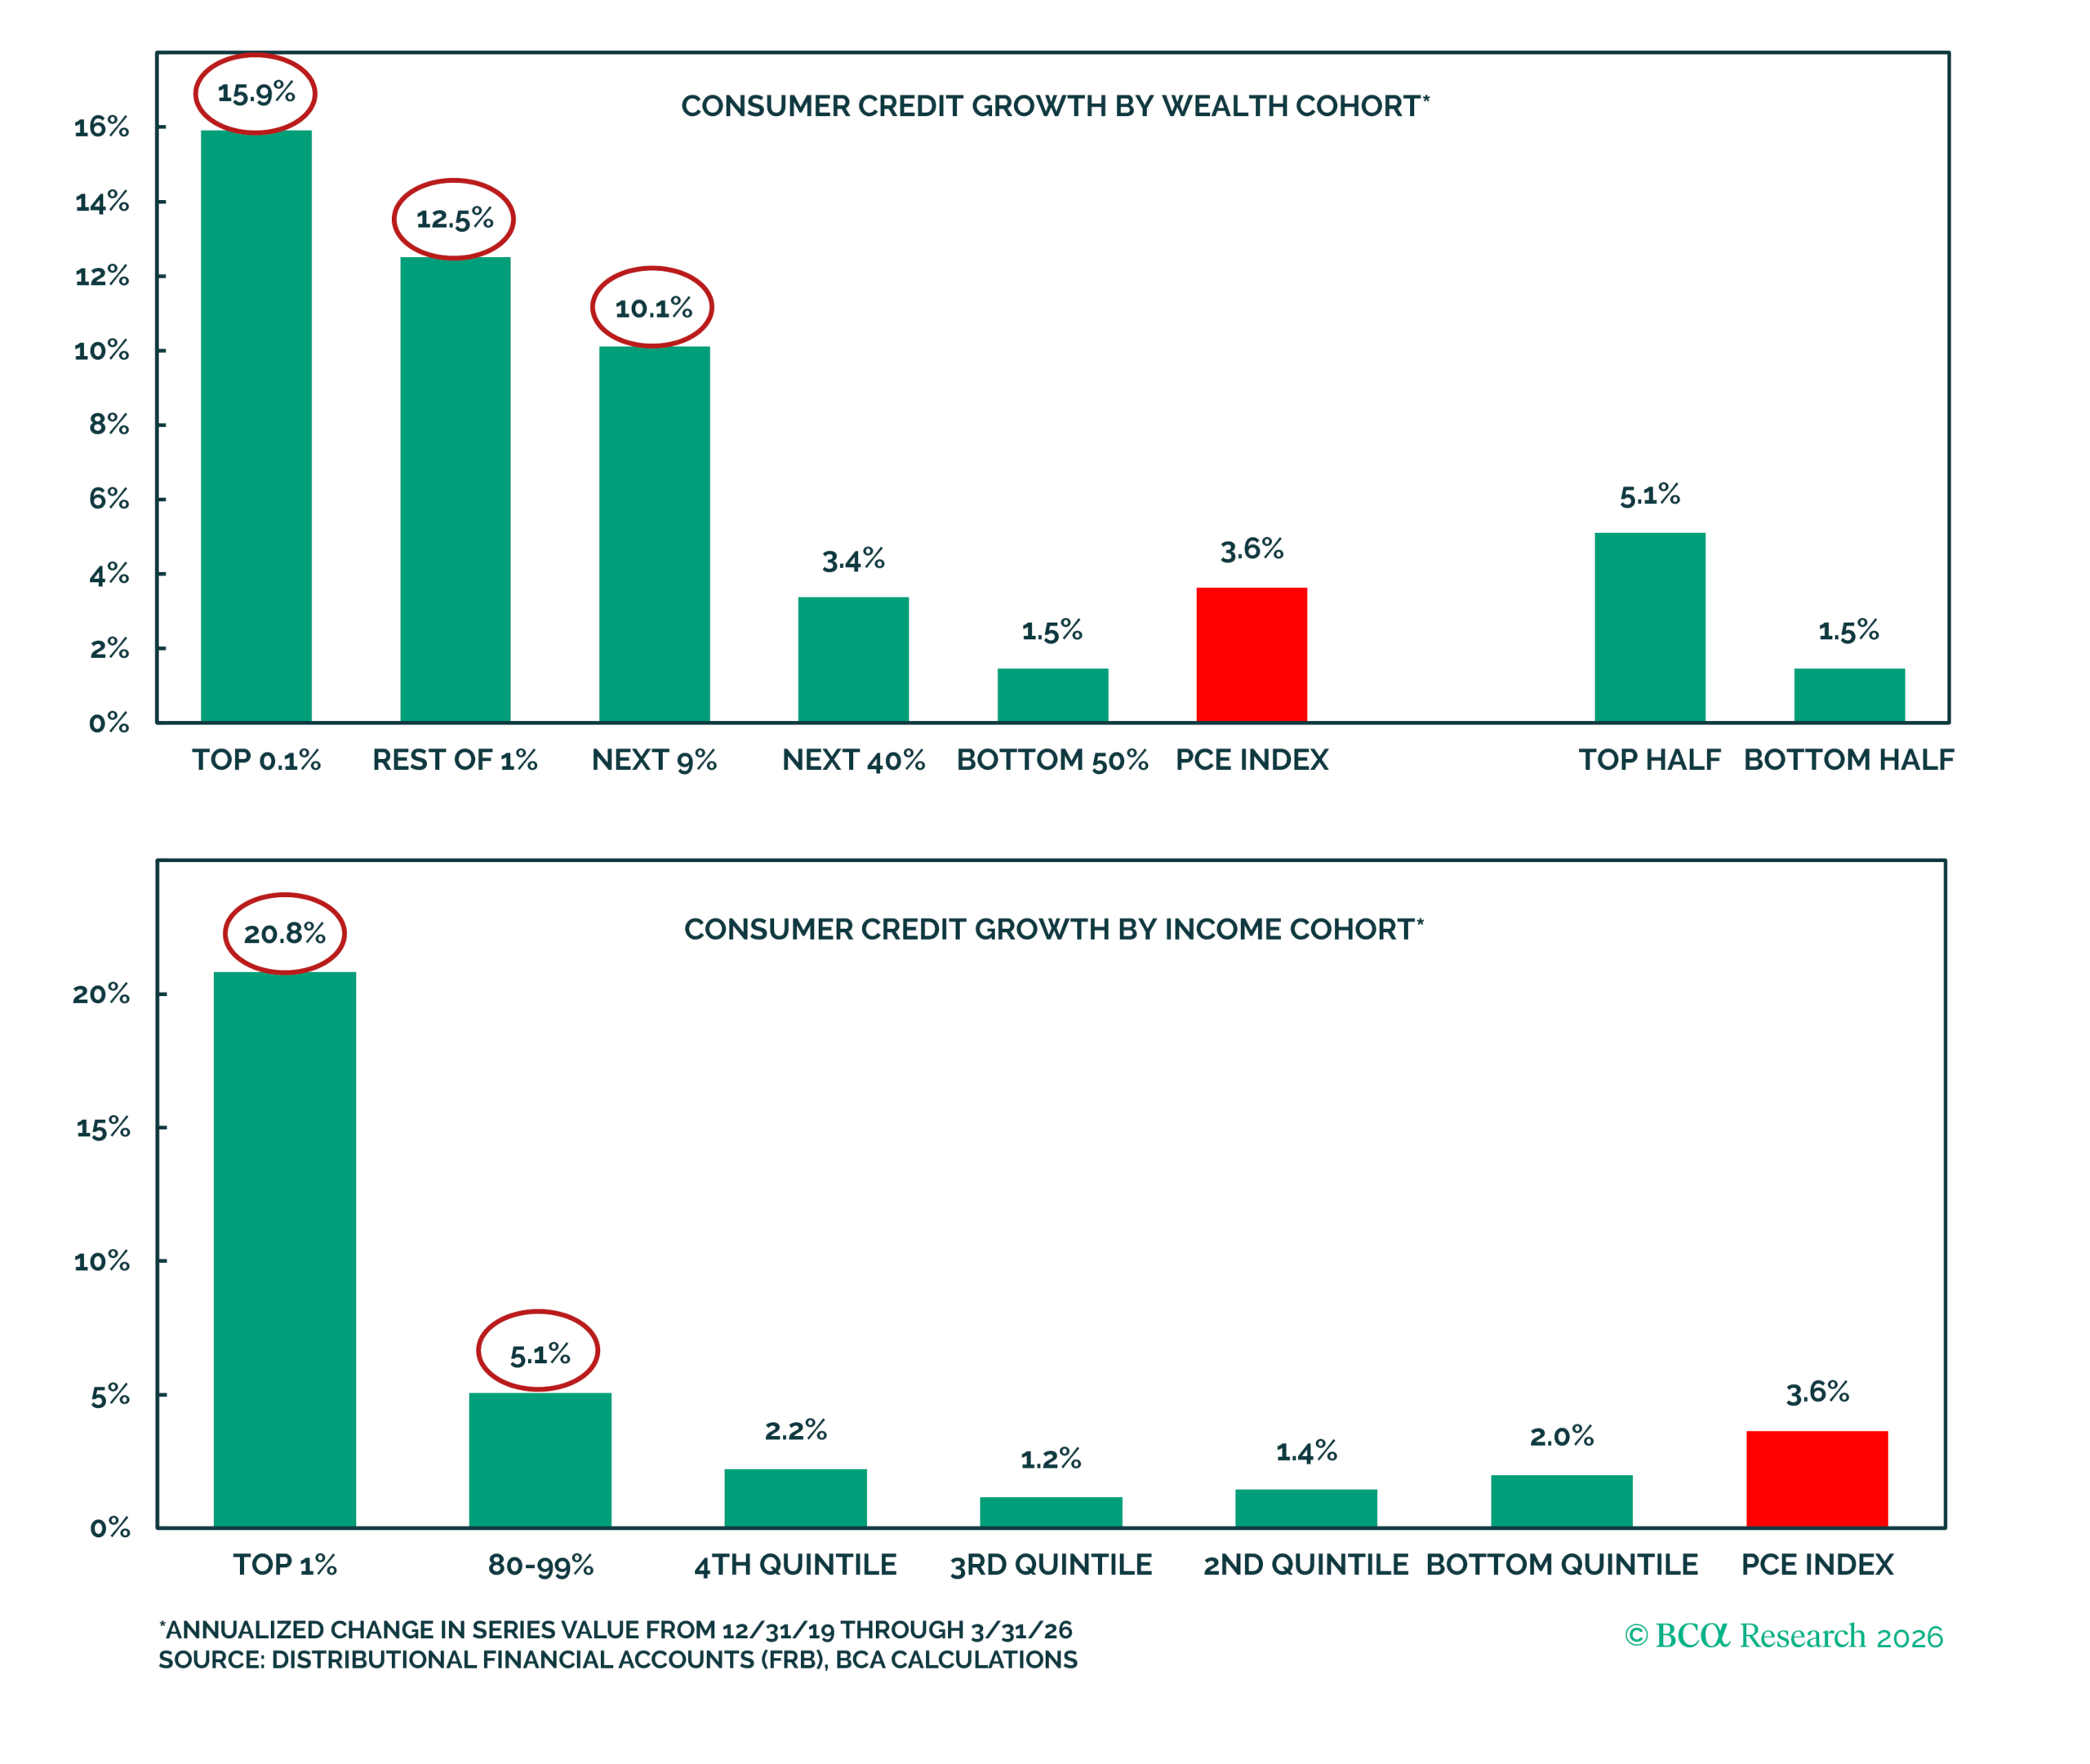
Figure 5 – The lower K have avoided debt like the plague
Furthermore, the lower leg of the K made a significant effort to not touch credit spending, likely as a trauma response to the Global Financial Crisis (“GFC”). Any growth in consumer credit so far has come predominantly from the upper leg – see Figure 5. This left the savings account as the dwindling last resort to keep up US spending culture. And yet, the economy persevered, with the labour market recovering suddenly in 2026.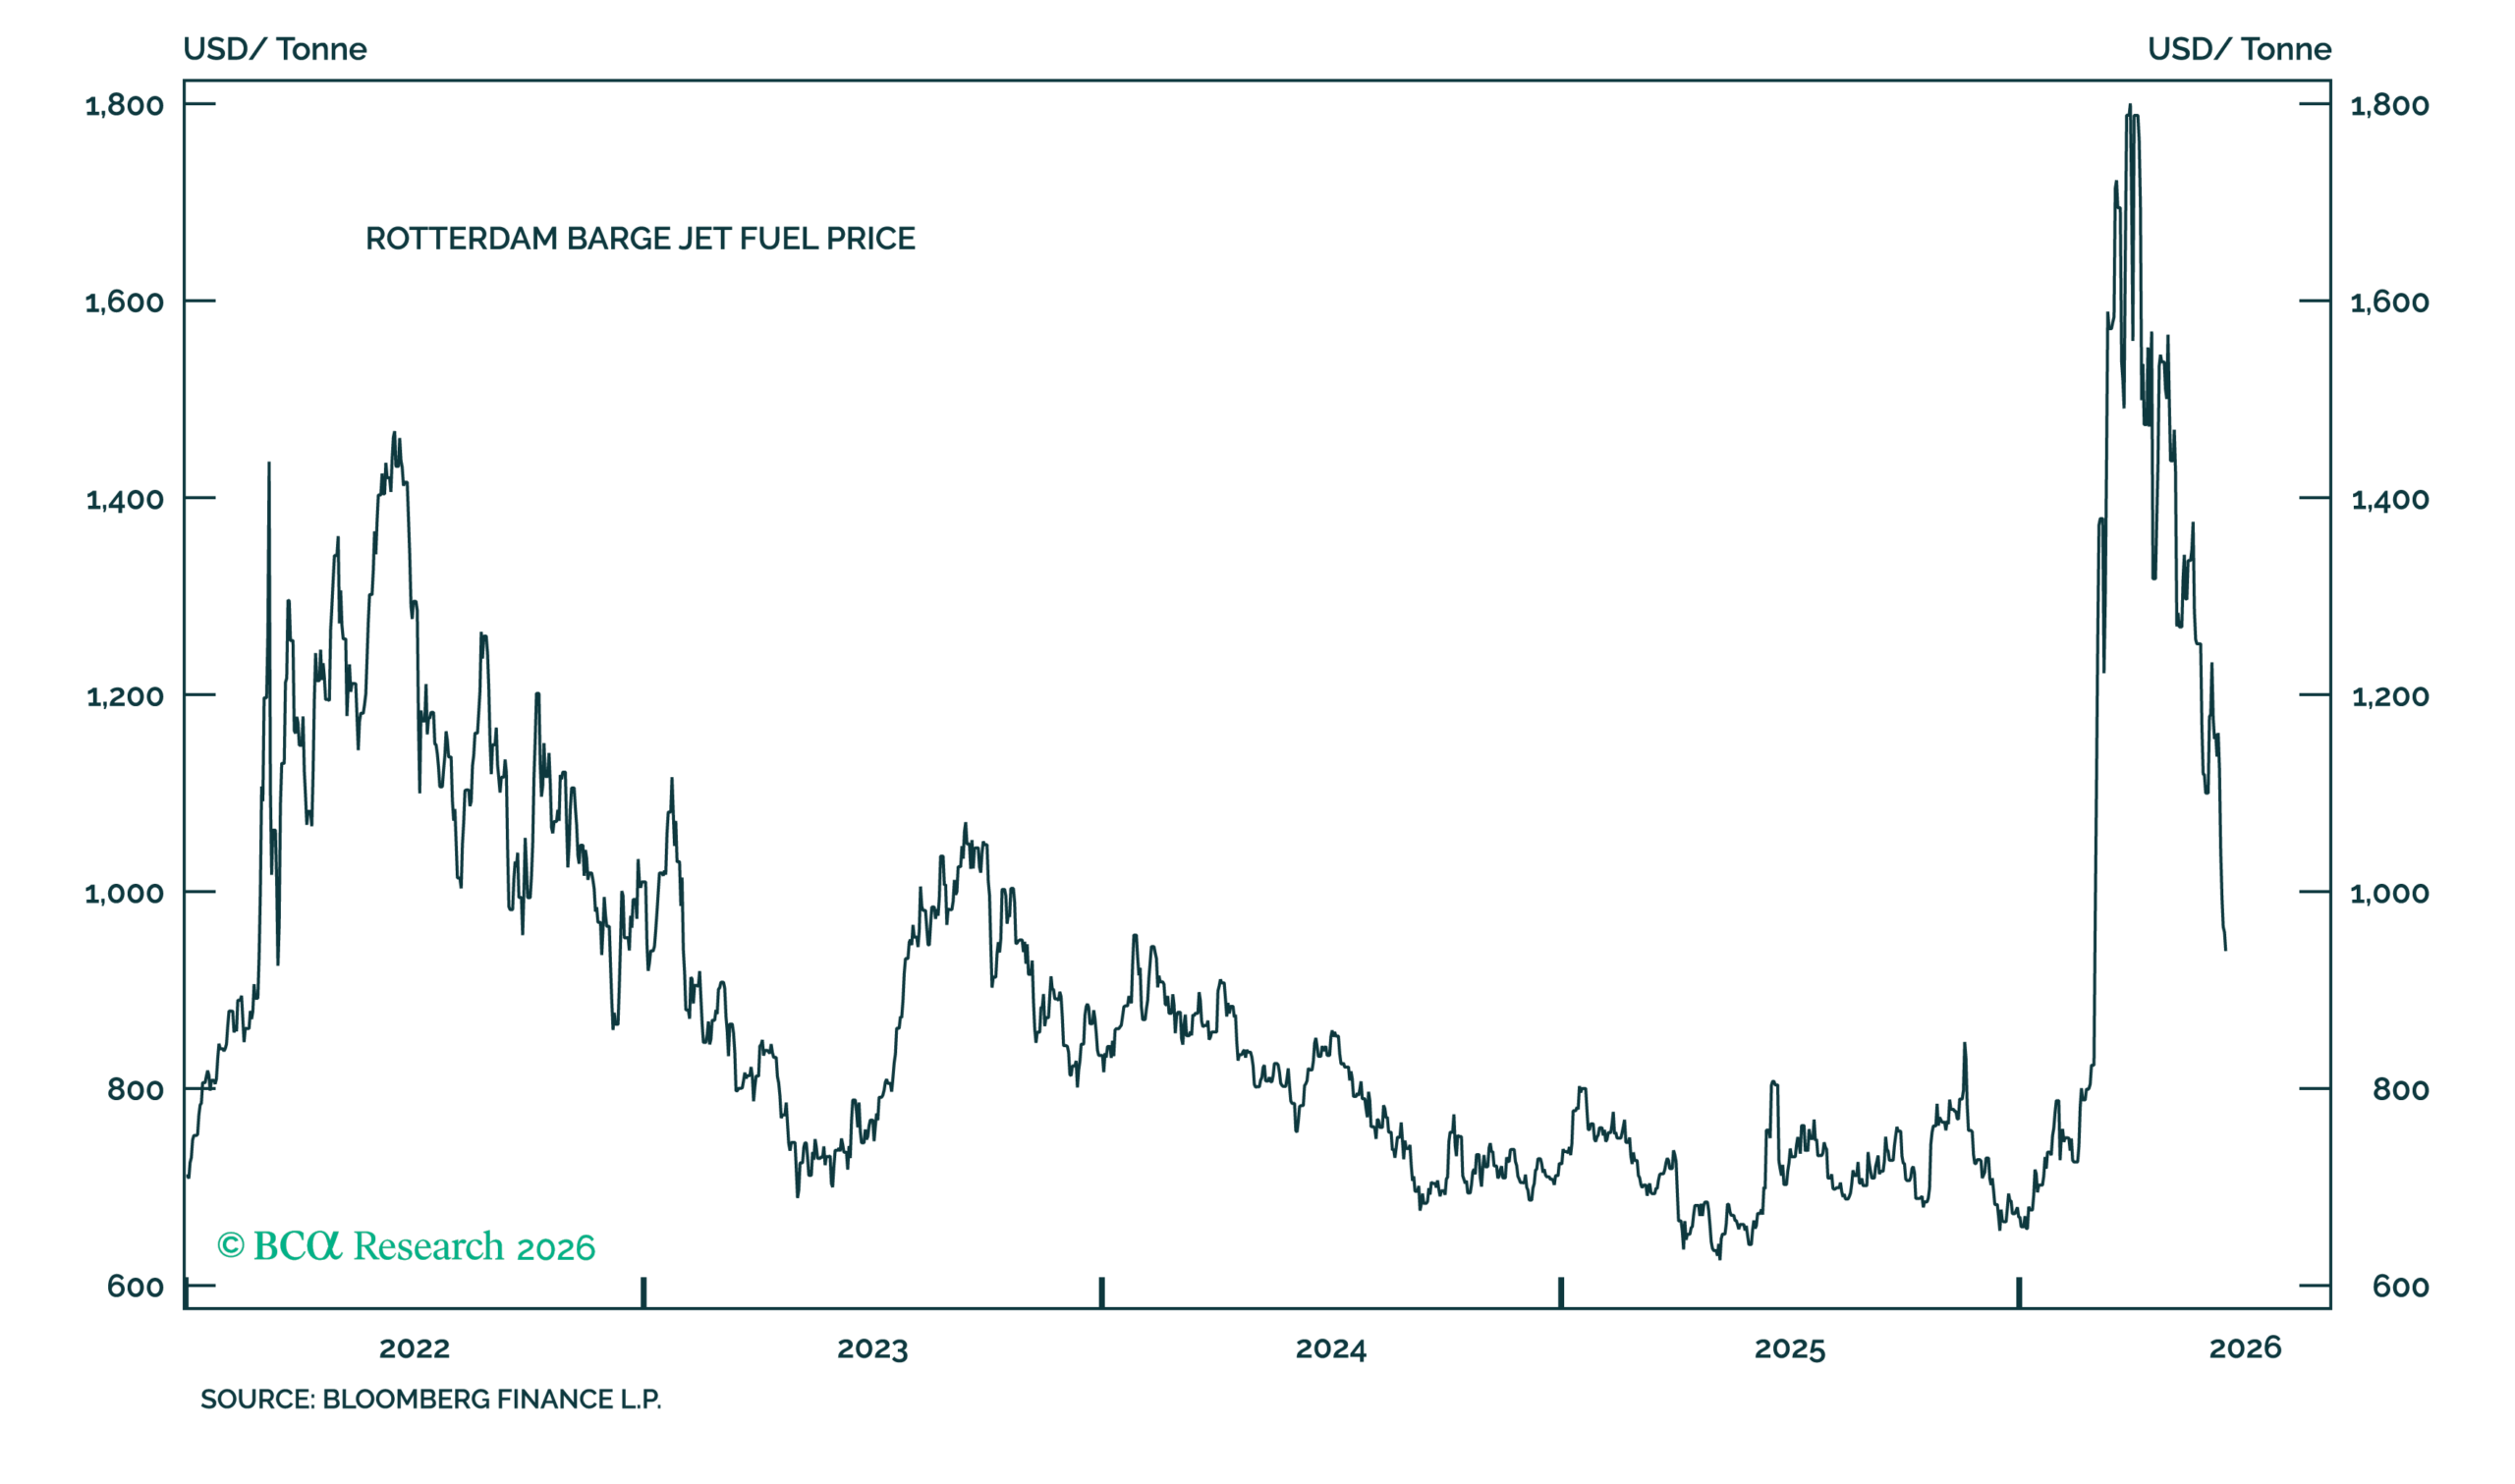
Figure 6 – Jet fuel has mostly erased its conflict price premium
This recovery was almost stopped right at its first step, when the US-Iran conflict broke out at the end of February. The oil price, fertiliser costs, and inflation expectations, all skyrocketed. Following a near 3-month exchange of rockets and words, the most robust version of a ceasefire so far is shakily in place. This comes just in time for the ongoing FIFA World Cup 2026, with jet fuel prices now almost 50% below their conflict-driven highs, potentially encouraging last-minute travel and further supporting US consumer spending – see Figure 6.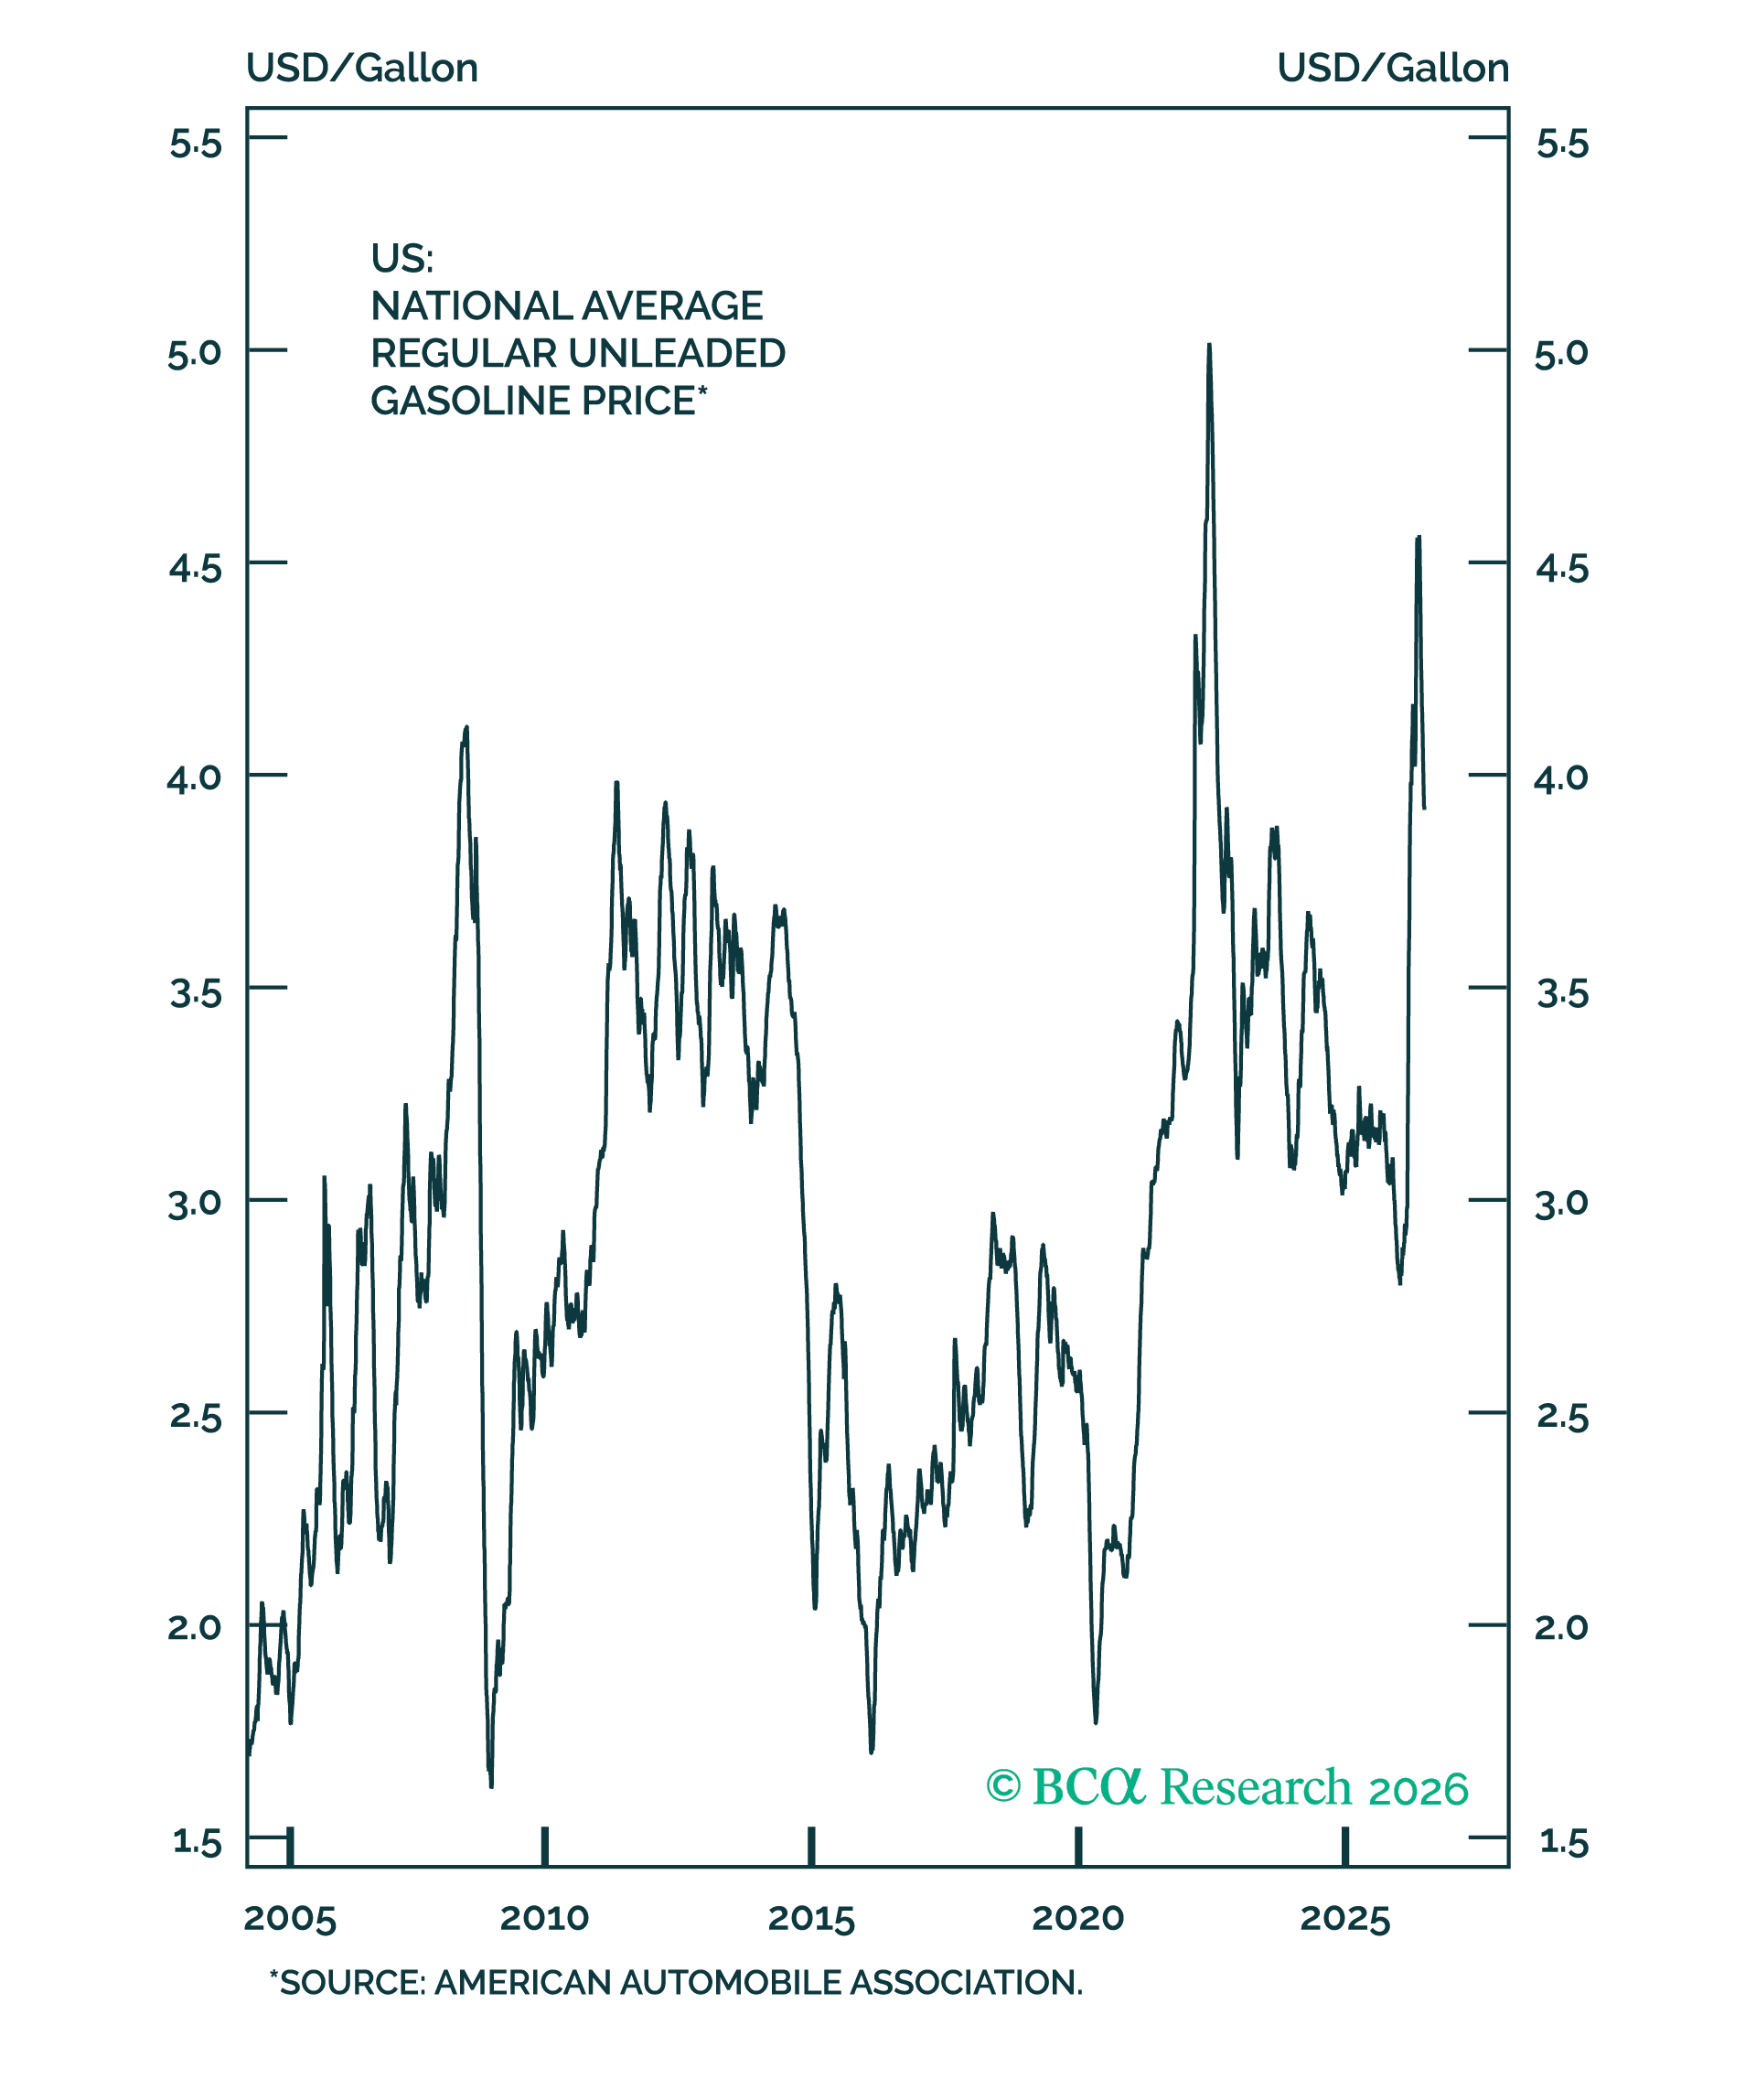
Figure 7 – While still far from its $3 recent low, gasoline prices have begun its downtrend
After it all, the average US consumer is all of a sudden in a far better place going into the back half of 2026, versus the first. The US average price of a gallon of regular unleaded gasoline has dipped below $4 for the first time since late March (see Figure 7), providing a welcome tailwind for consumers amid a recovering labour market.
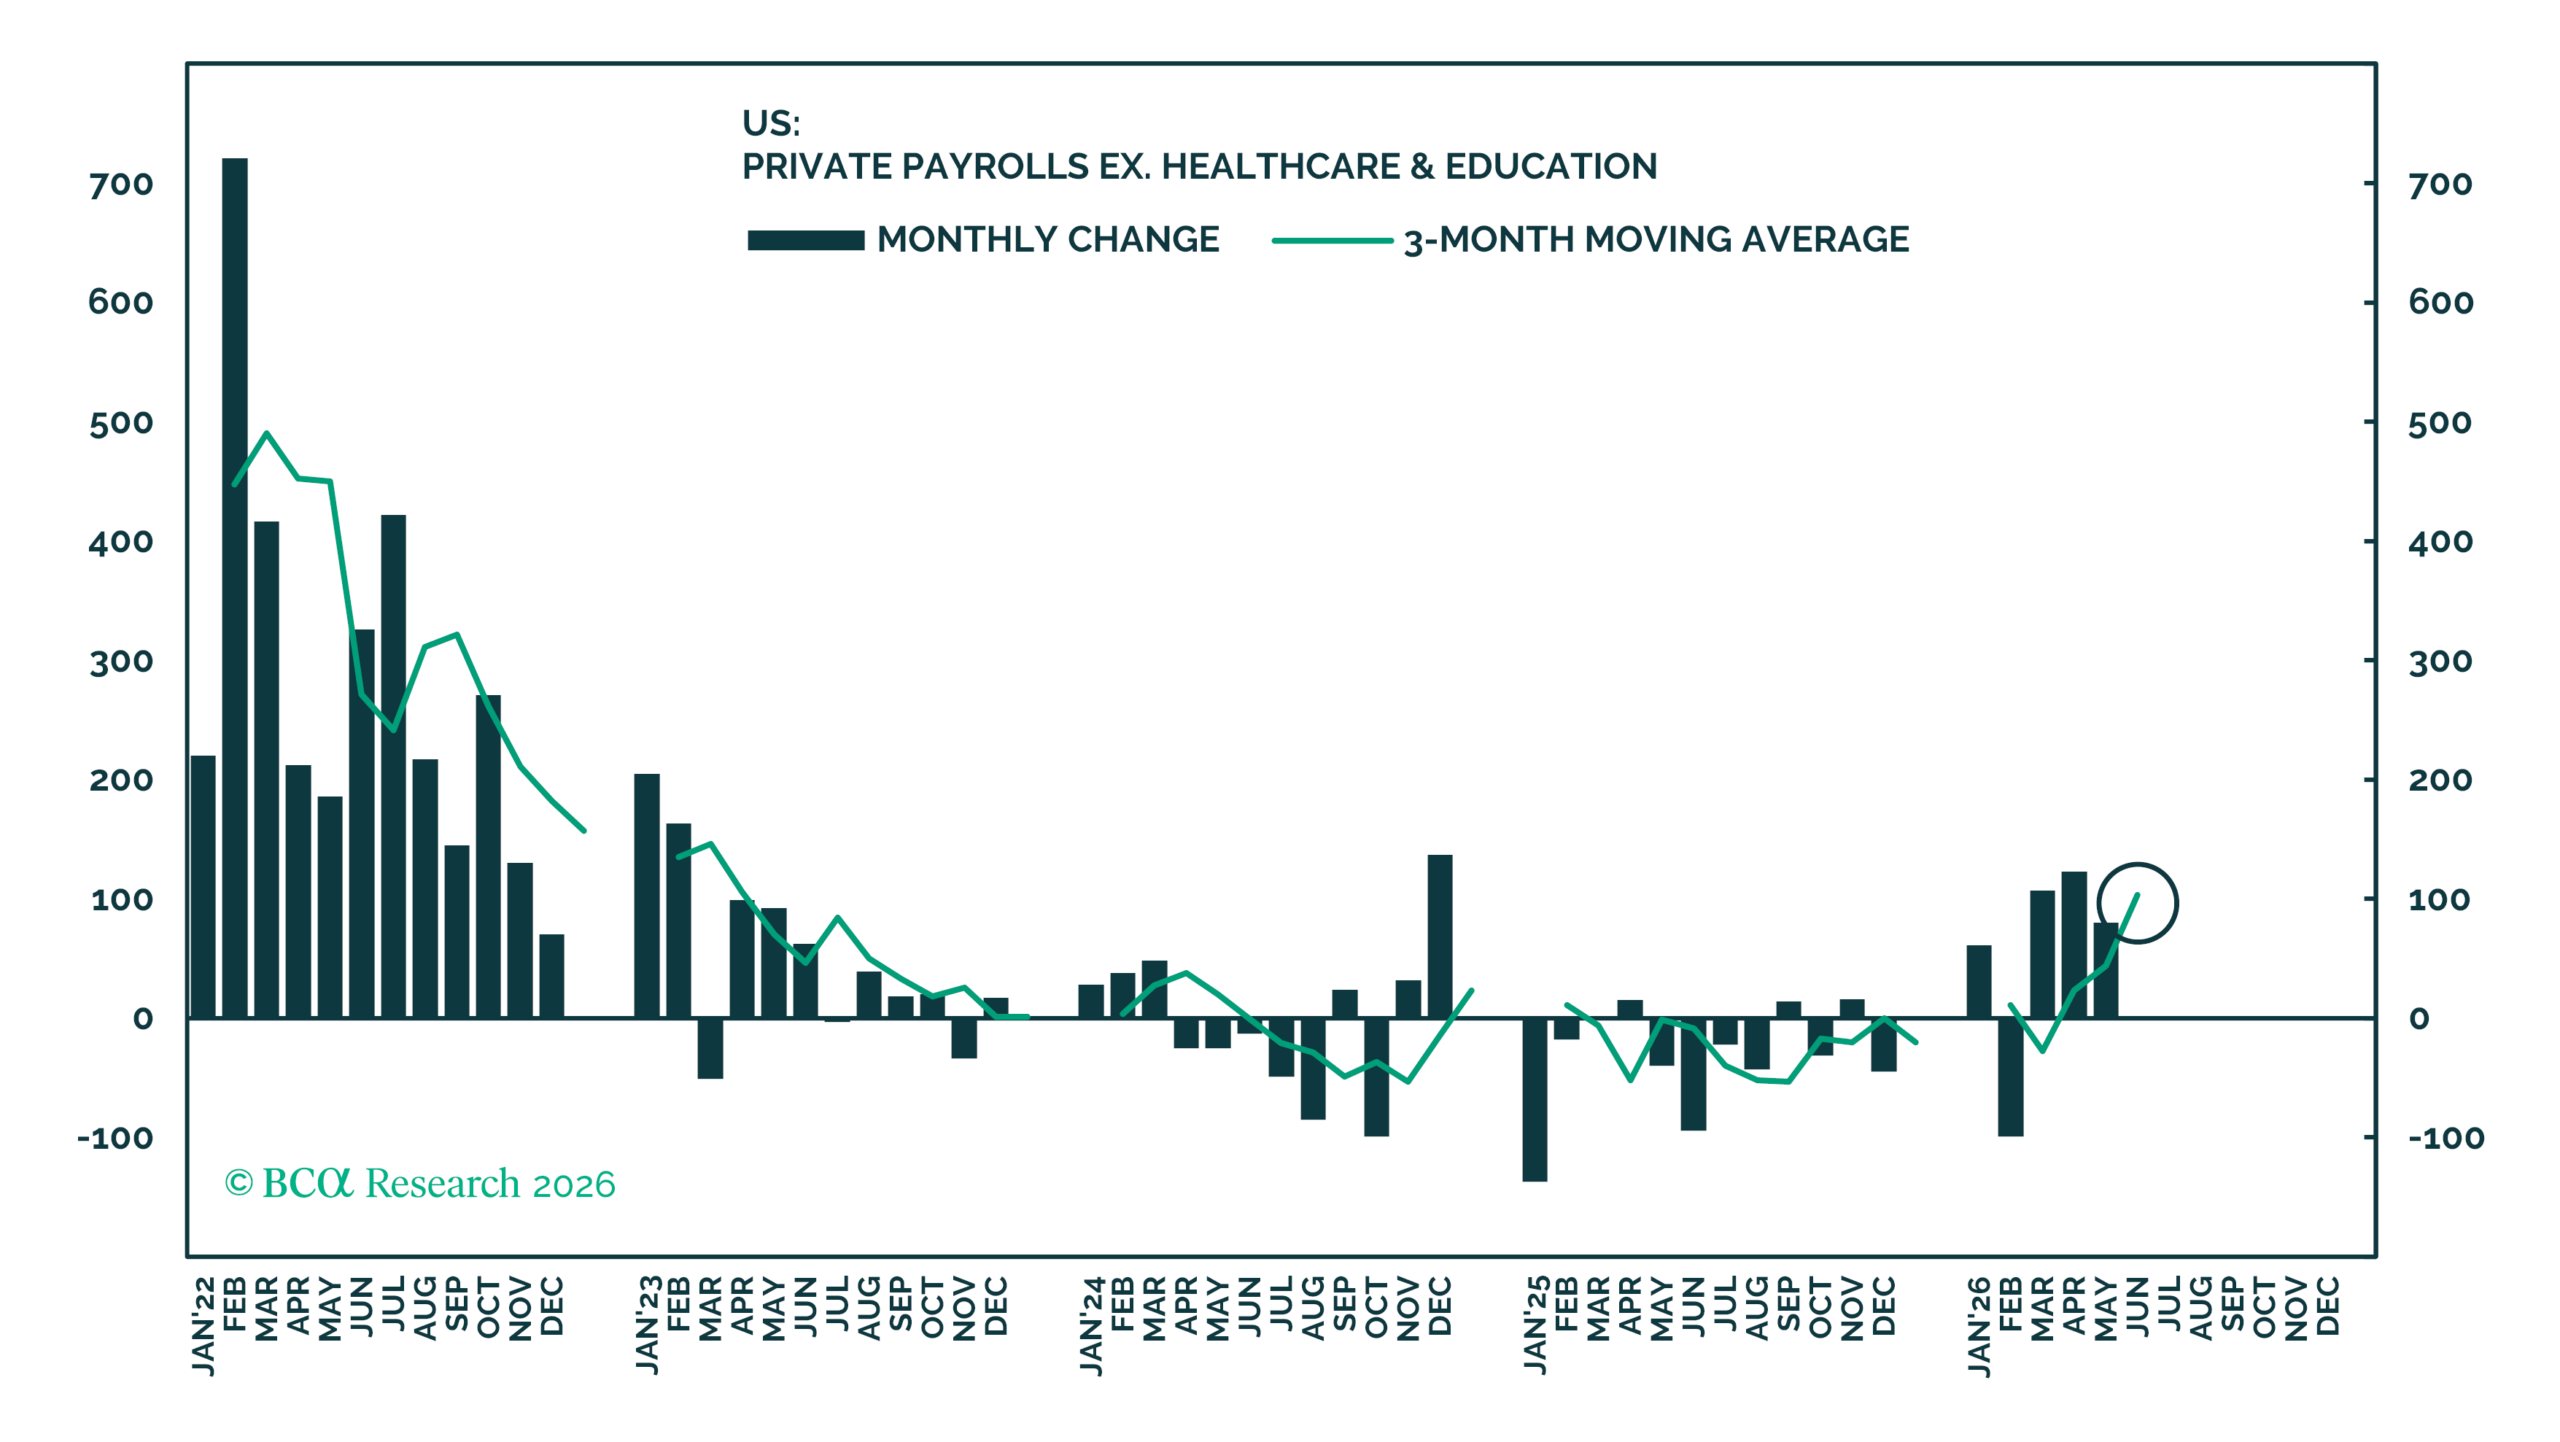
Figure 8 – The labour market is no longer relying on healthcare and education for growth
Additionally, 2026’s employment growth is becoming more broad-based rather than its prior concentration in health care and education (which drove nearly all job creation in 2025) – see Figure 8. Supporting this trend, the three-month average of private sector job growth excluding health care and education turned positive and reached 100,000 in May, the strongest reading in three years. Where the US goes from here will depend on how inflation dynamics play out, and how the now Warsh-led Fed will choose to deal with it.
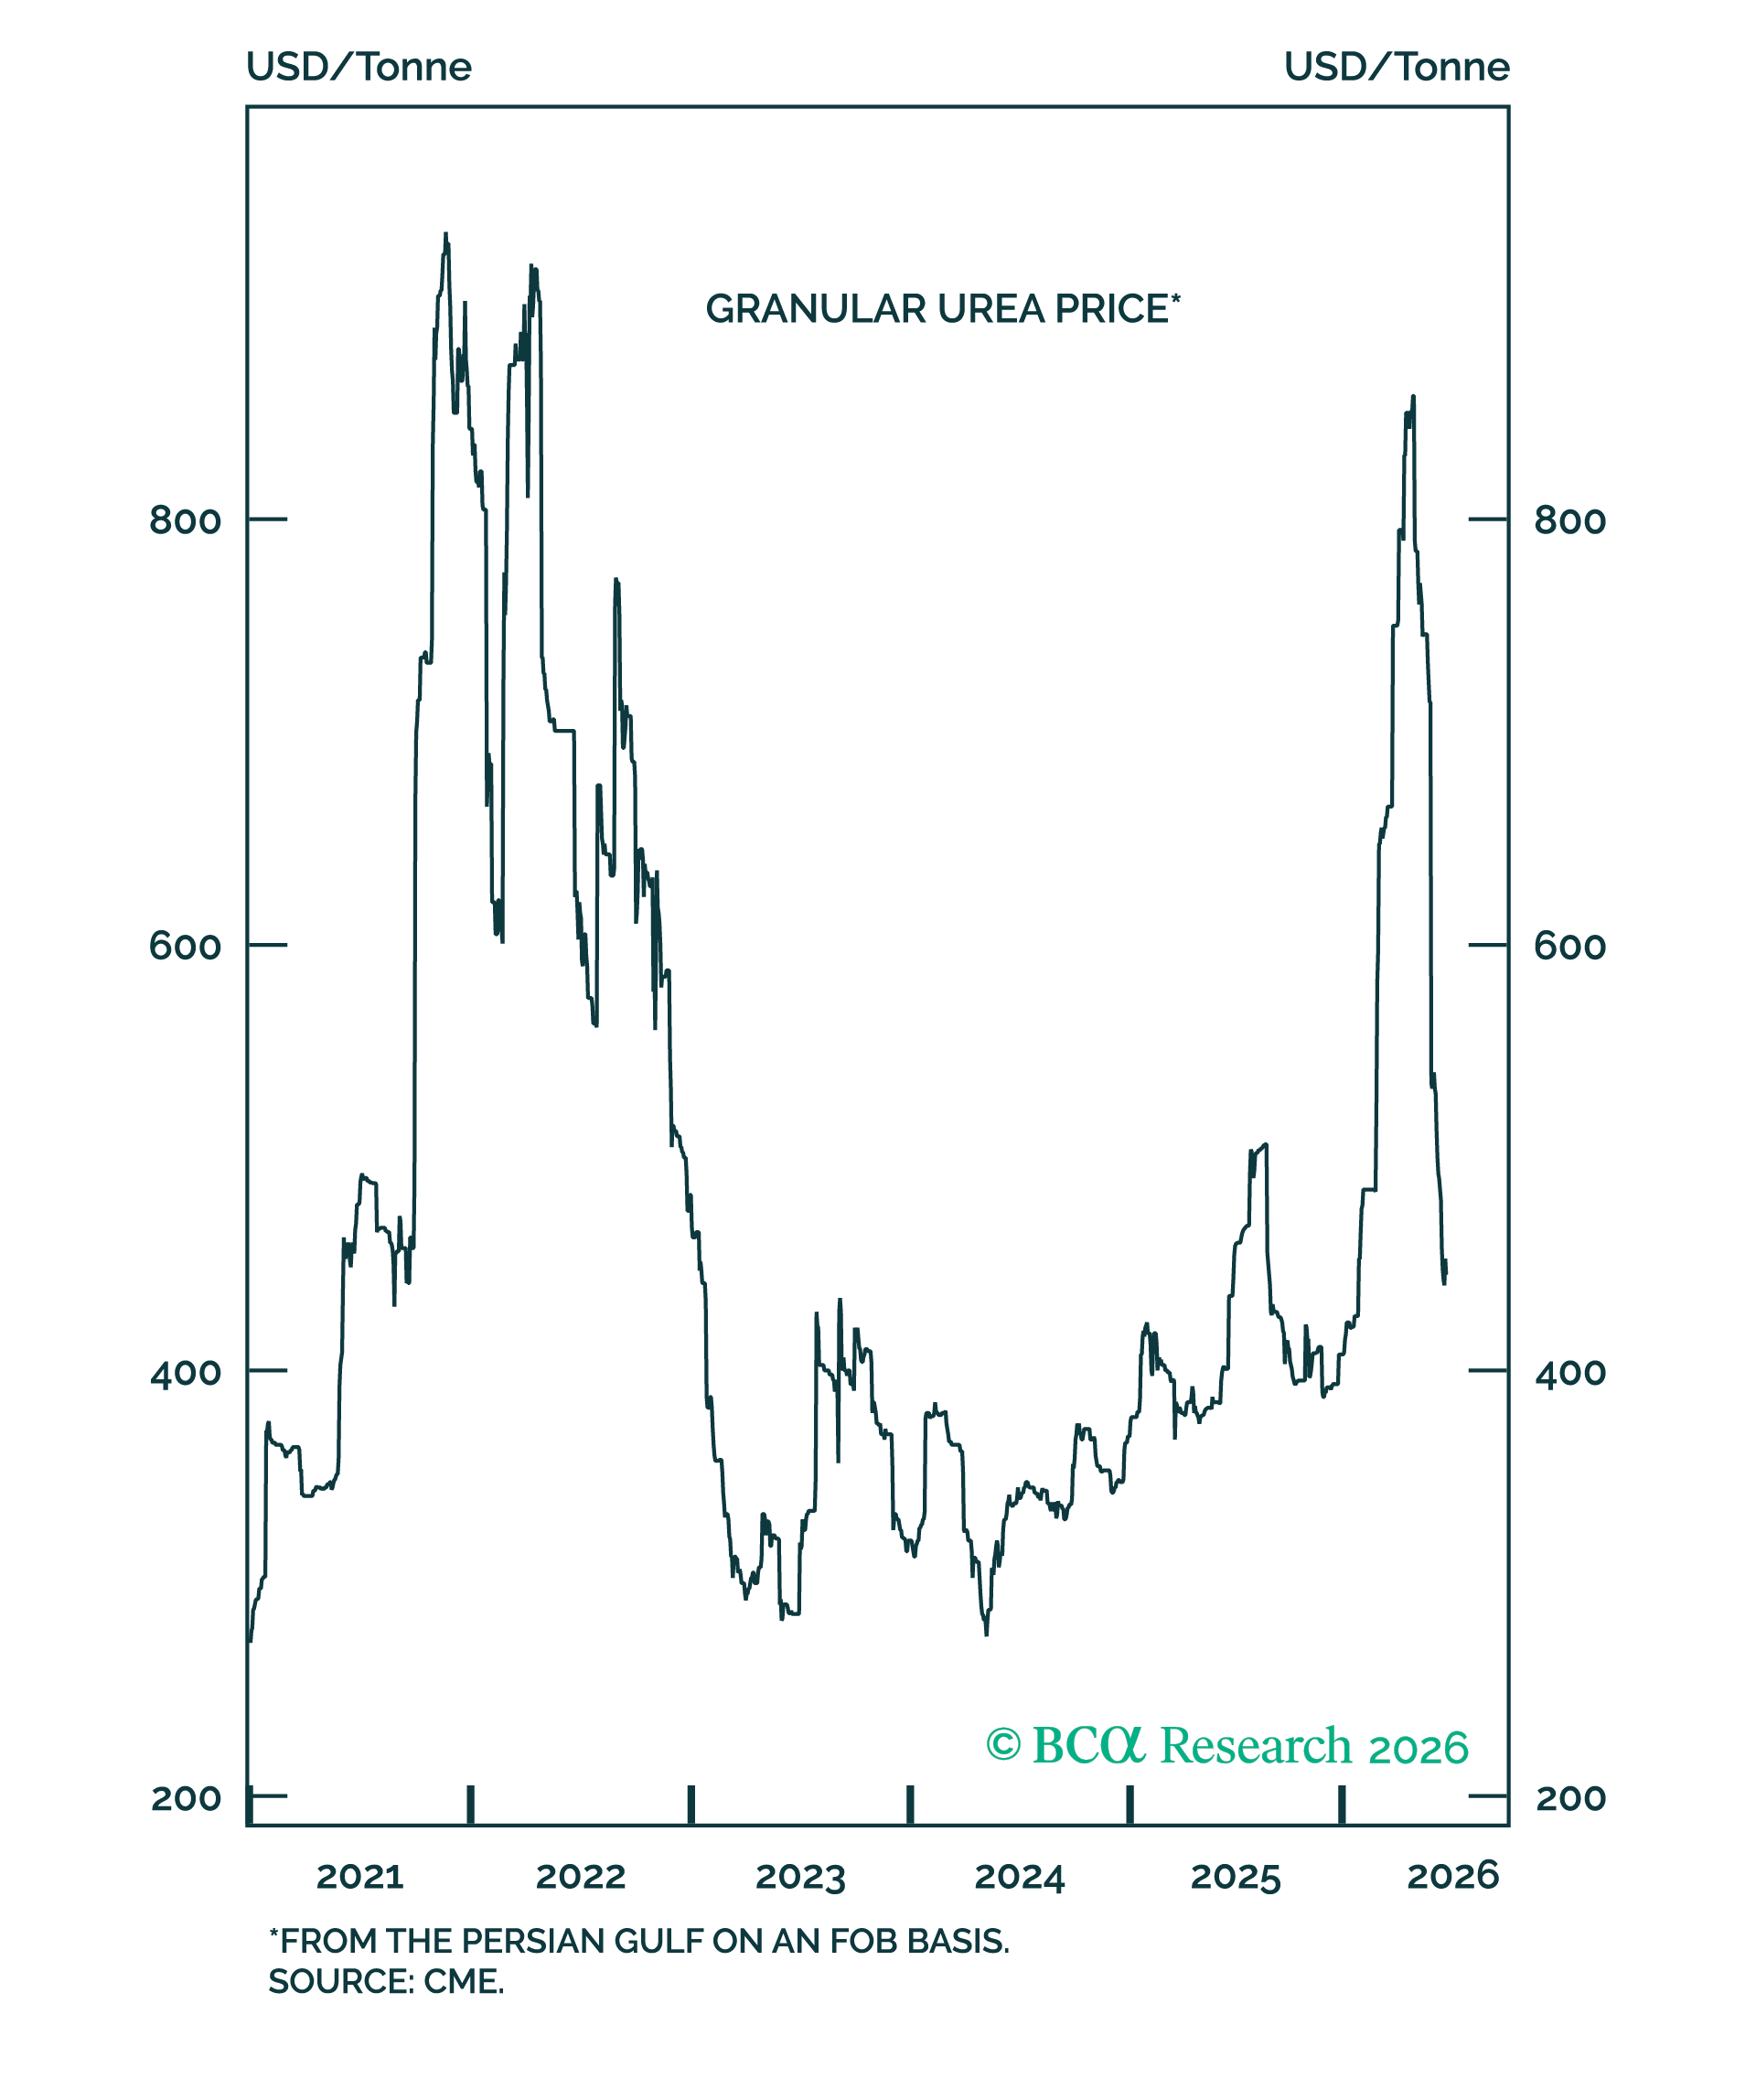
Figure 9 – Fertiliser costs should not be a risk factor for food production in the next season.
For now: Urea, a critical fertiliser feedstock, has tracked the downward trajectory of jet fuel, with prices also declining 50% from their late-April high – see Figure 9. This will help keep future food prices at pre-war expectations, at least until El Nino begins to affect global weather patterns.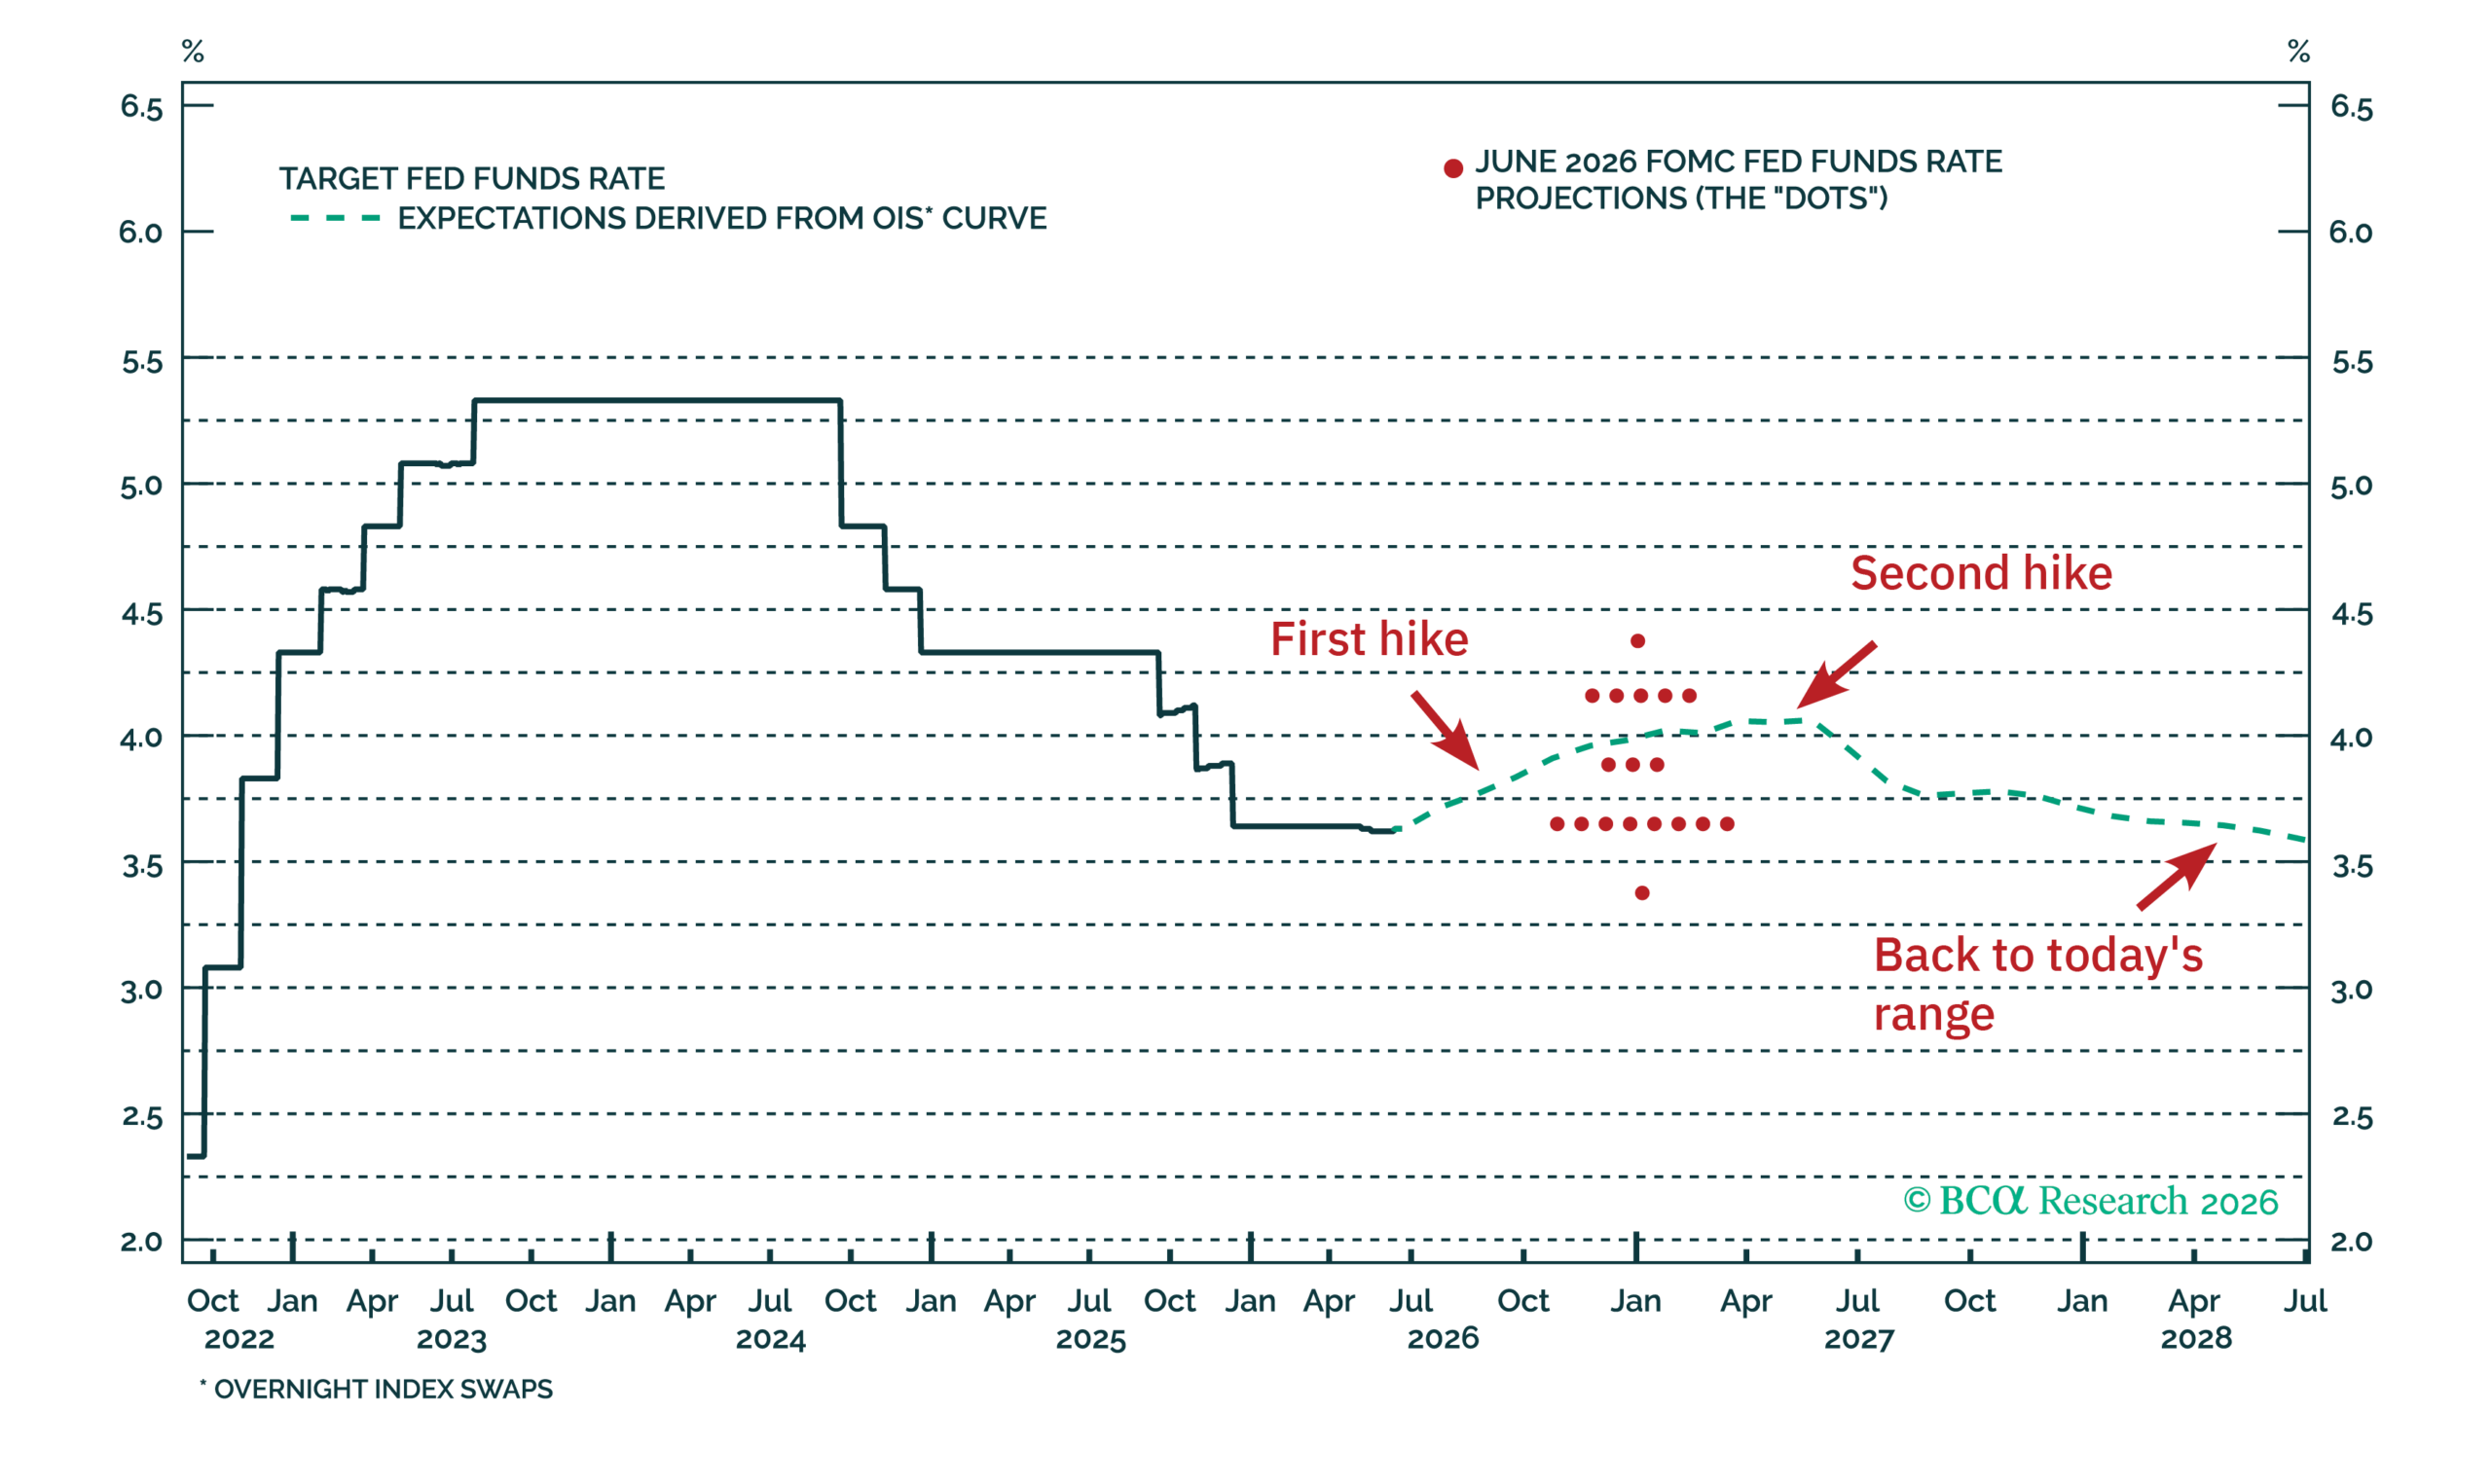
Figure 10 – The FOMC is unanimously giving a hawkish signal
Looking to the Fed, Warsh has begun his tenure as a hawk by all counts. Admittedly, this hawkishness was biased up more by other FOMC members, who have raised their target fed funds rate projections. Nine of the eighteen voters expect at least one 25 basis point rate hike before year-end. While expectations for a second hike have since eased, money markets do not anticipate rates returning to the current 3.50-3.75% range until mid-2028 – see Figure 10.
Investment takeaway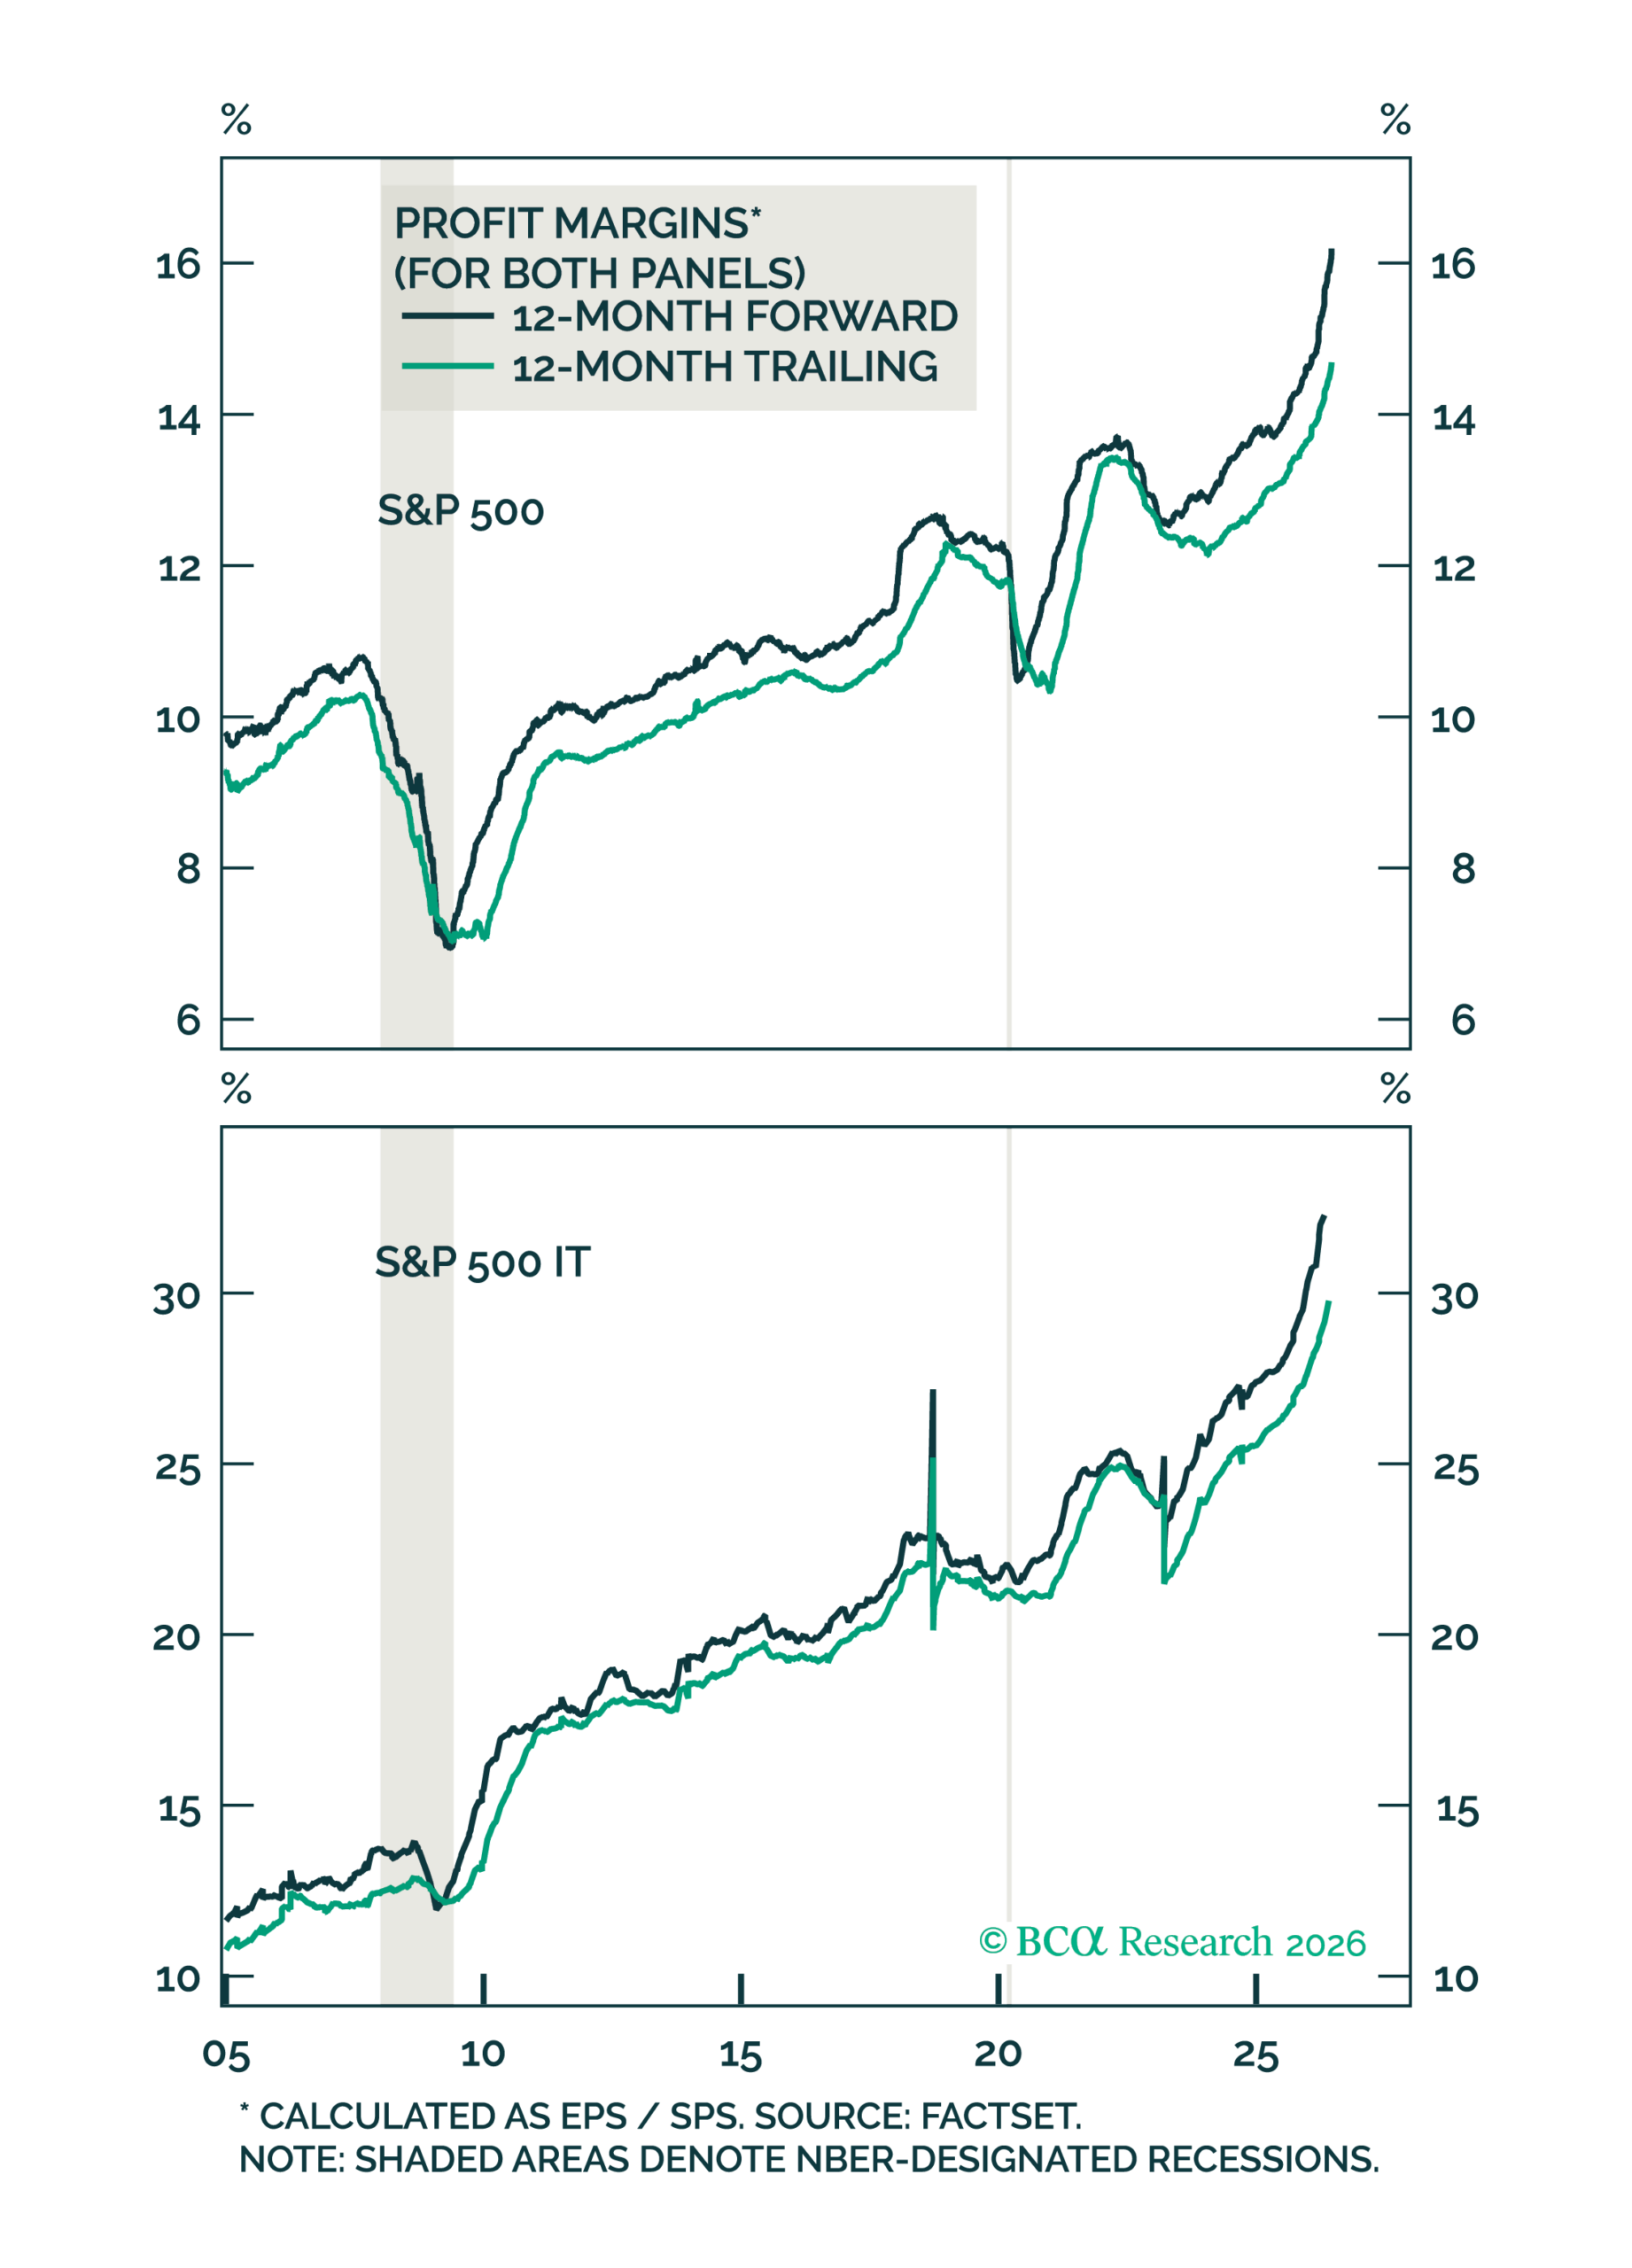
Figure 11 – AI profit margins are keeping the overall market profit biased upward
Global growth should still stand to benefit over the rest of the year from lower oil prices and the continuing boom in AI capex. The primary talking point remains the ongoing earnings bubble in AI. It bears mentioning this is not a bubble that investors are typically used to, characterised by an unsustainable rise in P/E ratios. A shortage trade has been the primary catalyst for massive profits for AI companies, particularly in the semiconductor industry. The S&P 500’s aggregate profit margin has seen an accelerated upswing, driven largely by increasing profitability in the tech sector – see Figure 11.
It is worth remembering the simple mechanics that are fuelling the accrual earnings boost. For now, semiconductor earnings have been a one-way street, with companies like Nvidia and Micron booking substantial profits from the inflated prices of their chips. Meanwhile, counterparties are recognising these as capitalised costs (or capital expenditure), meaning the strength of earnings in the market that has hit news headlines so far are only telling one side of the story. By definition this cannot last forever, all else equal, as the eventual depreciation expenses recognised by the buyers start bringing down market indices at the margin. The crux of the issue lies in whether the shortage in chips continues to override this via higher and higher margins upstream. Following its meteoric run, AI-linked equities may soon be approaching its late-stage cycle. On the other hand, various indicators such as the labour market suggest a stabilising of the economy, which would be supportive of earnings for non-tech industries.
If you are interested in finding out more about how cognisance of the macroeconomic backdrop impacts our investment decision making process, connect with Integrity Asset Management and let us help you navigate your investing journey.
For more information on this synopsis or to discuss solutions provided by Integrity Asset Management, please contact us at:
Tel: (021) 671 2112
Cell: 072 513 2684 / 084 601 1025
E-mail: nic@integrityam.co.za / herman@integrityam.co.za
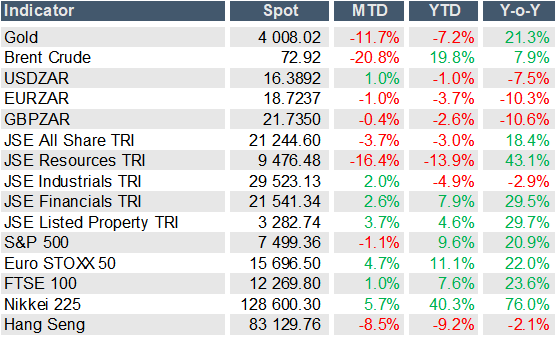
Source: Bloomberg, 30 June 2026