
Changing of the guard
Following the appointment of Kevin Warsh as the new Federal Reserve (“Fed”) Chair, the US central bank may soon see its most significant philosophical shift since the Global Financial Crisis (“GFC”). Ignoring the short-term policy action that may be warranted given stubborn inflation, the monetarist-leaning attitude of Warsh contrasts sharply with the prior Bernanke-Yellen-Powell era which was marked by 1) a dovish bias, 2) commitment to persistently low neutral rates, and 3) a greater emphasis on preventing recessions than curbing above-target inflation.
Warsh’s support for balance sheet reduction, limited forward guidance, and the view that excessive money creation fuels inflation reflects the more rules-based approach associated with Alan Greenspan’s Fed in the 1990s. The key question is whether he would emulate this era of Greenspan’s decisions which usually aligned with the Taylor Rule, or his more accommodative regime which helped foster the excesses of the early 2000s. Distinguishing between these two distinct and mostly opposing approaches will inform the potential monetary support from the Fed over the coming years.
A collision course
Parallel to US-Iran ceasefire talk leaning to a “relatively” more positive regime, equity markets have chosen to fade out all risks so far. However, an end to the crisis around the Strait of Hormuz crisis is not necessarily imminent. The conflict can still get worse before it gets better. Ignoring it could be folly: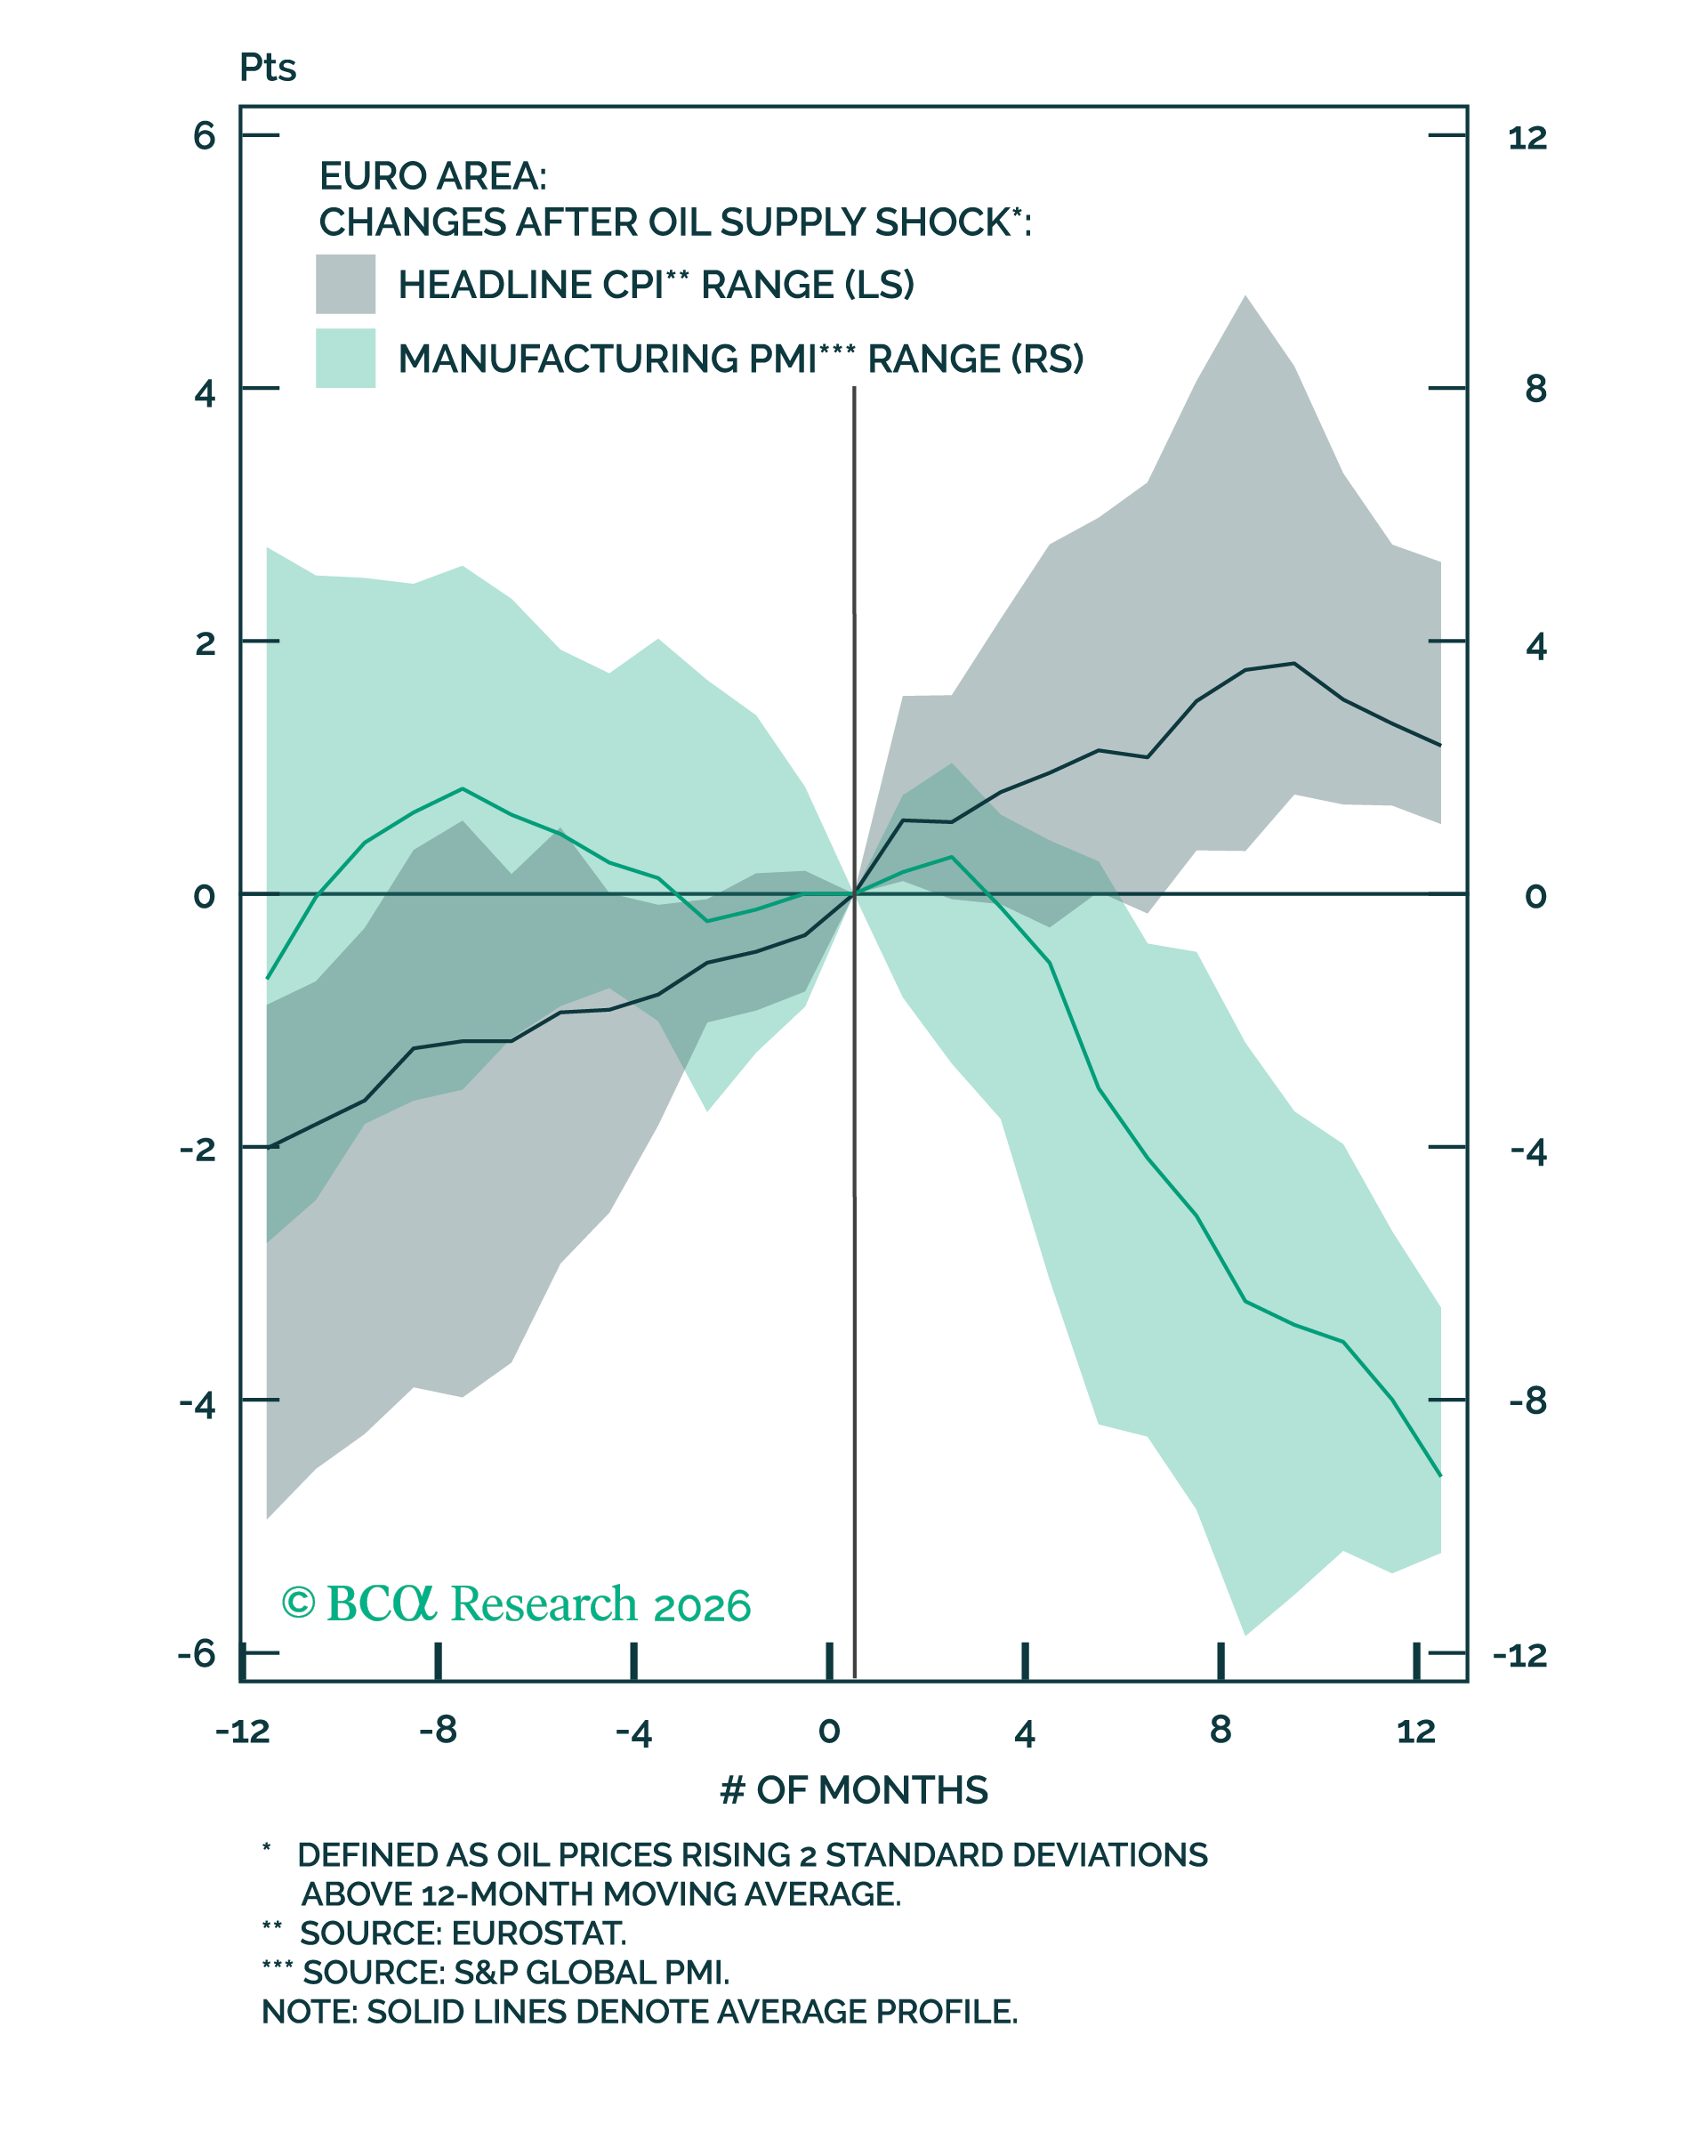
Figure 1 – Prices lead activity with a lag
Over the past two decades, every major oil supply shock has ultimately been followed by a European recession. The mechanism is similar each time: Higher energy prices push up inflation, raising stagflation risks and prompting the ECB to tighten monetary policy. Economic activity typically proves more resilient initially, but after a lag of several months, growth weakens and the economy contracts. While inflation responds almost immediately to the shock, the downturn in activity emerges more gradually – see Figure 1.
Figure 2 – Eurozone activity slips below expansion threshold
The eurozone’s flash PMI for May has already slipped below the 50-threshold separating expansion from contraction, suggesting that economic weakness may soon become more pronounced – see Figure 2.
Figure 3 – The hiring freeze has ended
The US is in a comparatively better position on account of their US shale advantage. Furthermore, the labour market has thawed moderately, with some indicators reflecting 2025 as the trough – see Figure 3.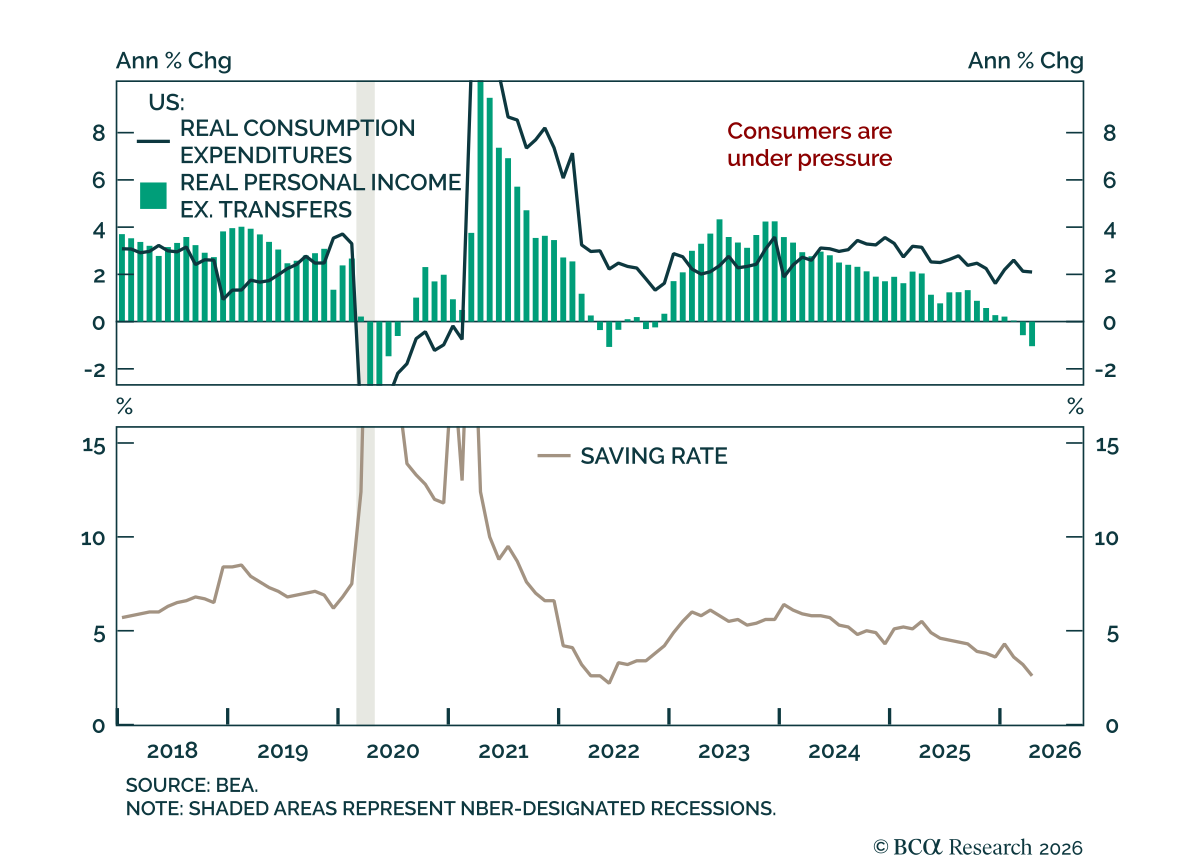
Figure 4 – The saving cushion is fading
Still, US demand is showing signs of fatigue as income growth falls behind spending. Q1 GDP was revised lower due to weaker consumer spending, while April income growth stalled and disposable income declined. Households continue to spend, but increasingly by drawing down savings, pushing the savings rate to just 2.6%, a near historic low outside the pre-GFC and post-pandemic periods – see Figure 4. Spending also moderated but remained positive at 0.5% month-on-month in nominal terms, suggesting households continue to spend despite increasingly weak income growth. Consistent with this softer demand backdrop, April core PCE inflation also came in below expectations. With the savings buffer largely exhausted, any additional shock such as a prolonged Strait of Hormuz disruption, could further weaken domestic demand.
Figure 5 – The current yield curve signal has historically preceded policy tightening
The Fed faces a critical decision: Whether to raise rates or remain on hold. Recent market developments have strengthened the case for another hike, with the two-year Treasury yield moving above the federal funds rate. Historically, this has been a meaningful signal, as over the past 30 years every instance in which the two-year yield exceeded the policy rate was followed by a Fed rate increase – see Figure 5.
Silicon Dreams
Looking past the economy, equities have continued to grind higher, reviving concerns about a potential bubble. While equity bubbles are typically associated with rapid multiple expansion (P/E re-rating), at times it can instead manifest through earnings, as may be the case today. Semiconductor companies are no stranger to earnings cycles themselves.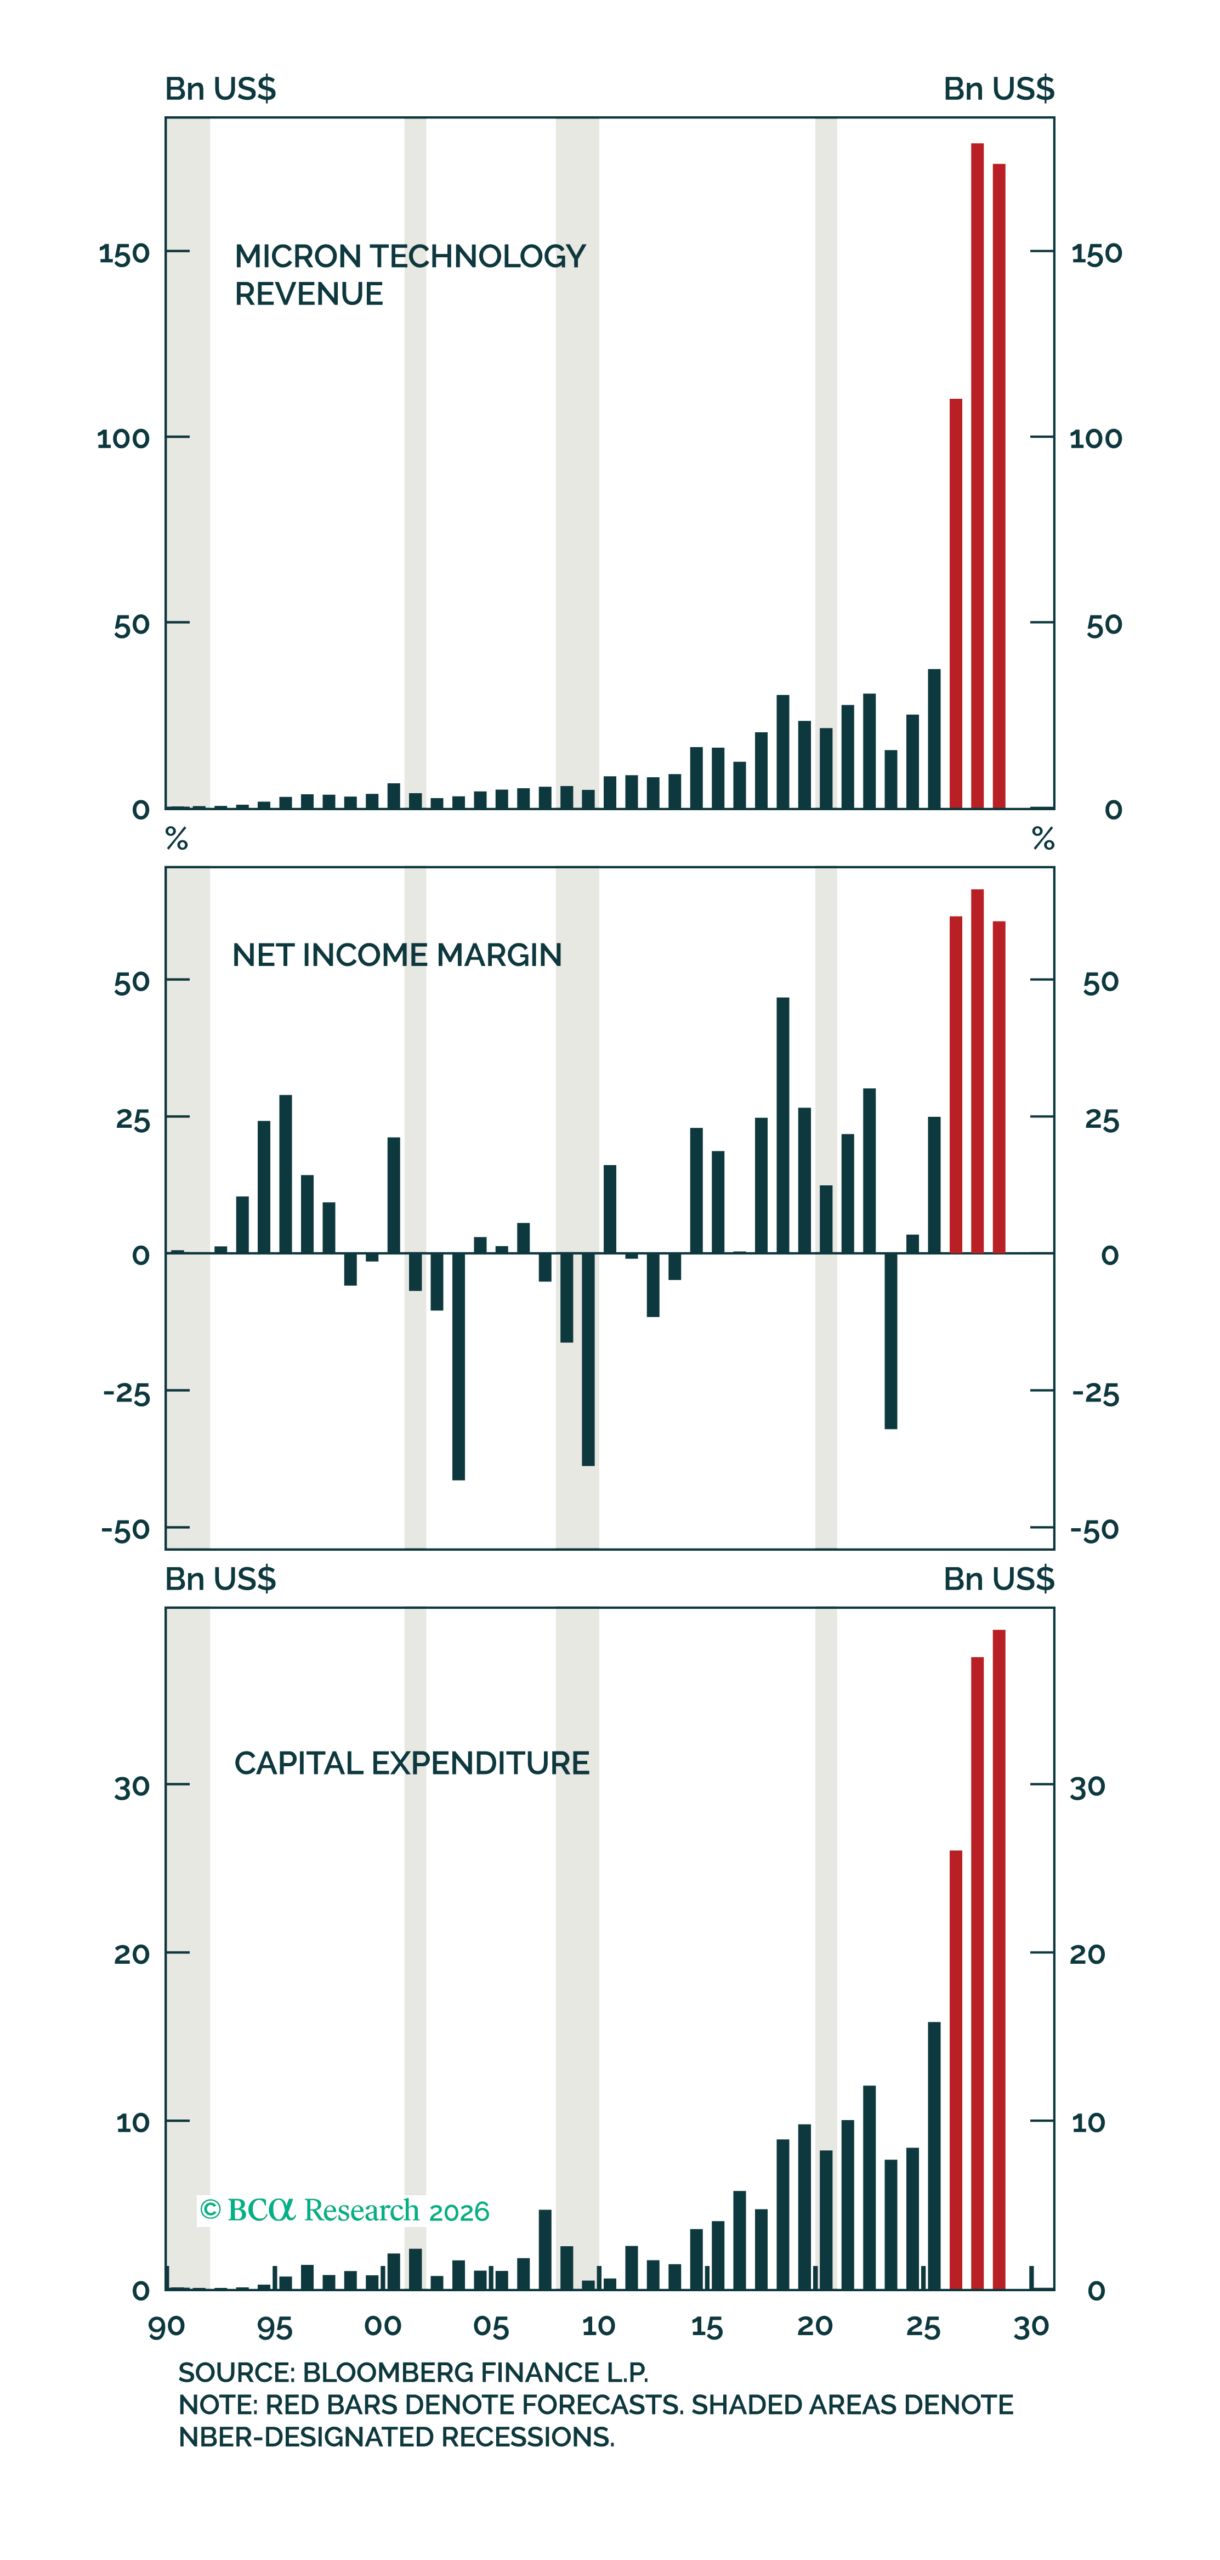
Figure 6 – Historically, Micron has been the undisputed champion of cyclicality
1993-1996: Following a surge in PC adoption and upgrades, memory shares experienced their first significant boom-bust cycle. Micron’s net income surged from $104 million in FY1993 to $844 million in FY1995 before entering a prolonged decline. Aside from a brief stint of profitability in FY2000, the company posted losses in every year from 1998 through 2003 – see Figure 6.
1999–2001: During the dotcom and telecom boom-bust, Intel’s revenue expanded dramatically through the 1990s, peaking at $33.7 billion in 2000 after nearly a tenfold increase. That momentum reversed sharply in 2001, when sales fell 21% and net margins compressed from 31% to just 5%. More broadly, the global semiconductor industry experienced a 32% contraction that year.
2016–2020: A semiconductor boom-bust linked to the GPU crypto mining boom, ending with an excess supply to normalised demand.
2021–2023: The COVID cycle. The shift to remote work, online schooling, and goods consumption triggered a surge in electronics demand and semiconductor sales, which then reversed in 2023 as PC, smartphone, and cloud customers cut orders.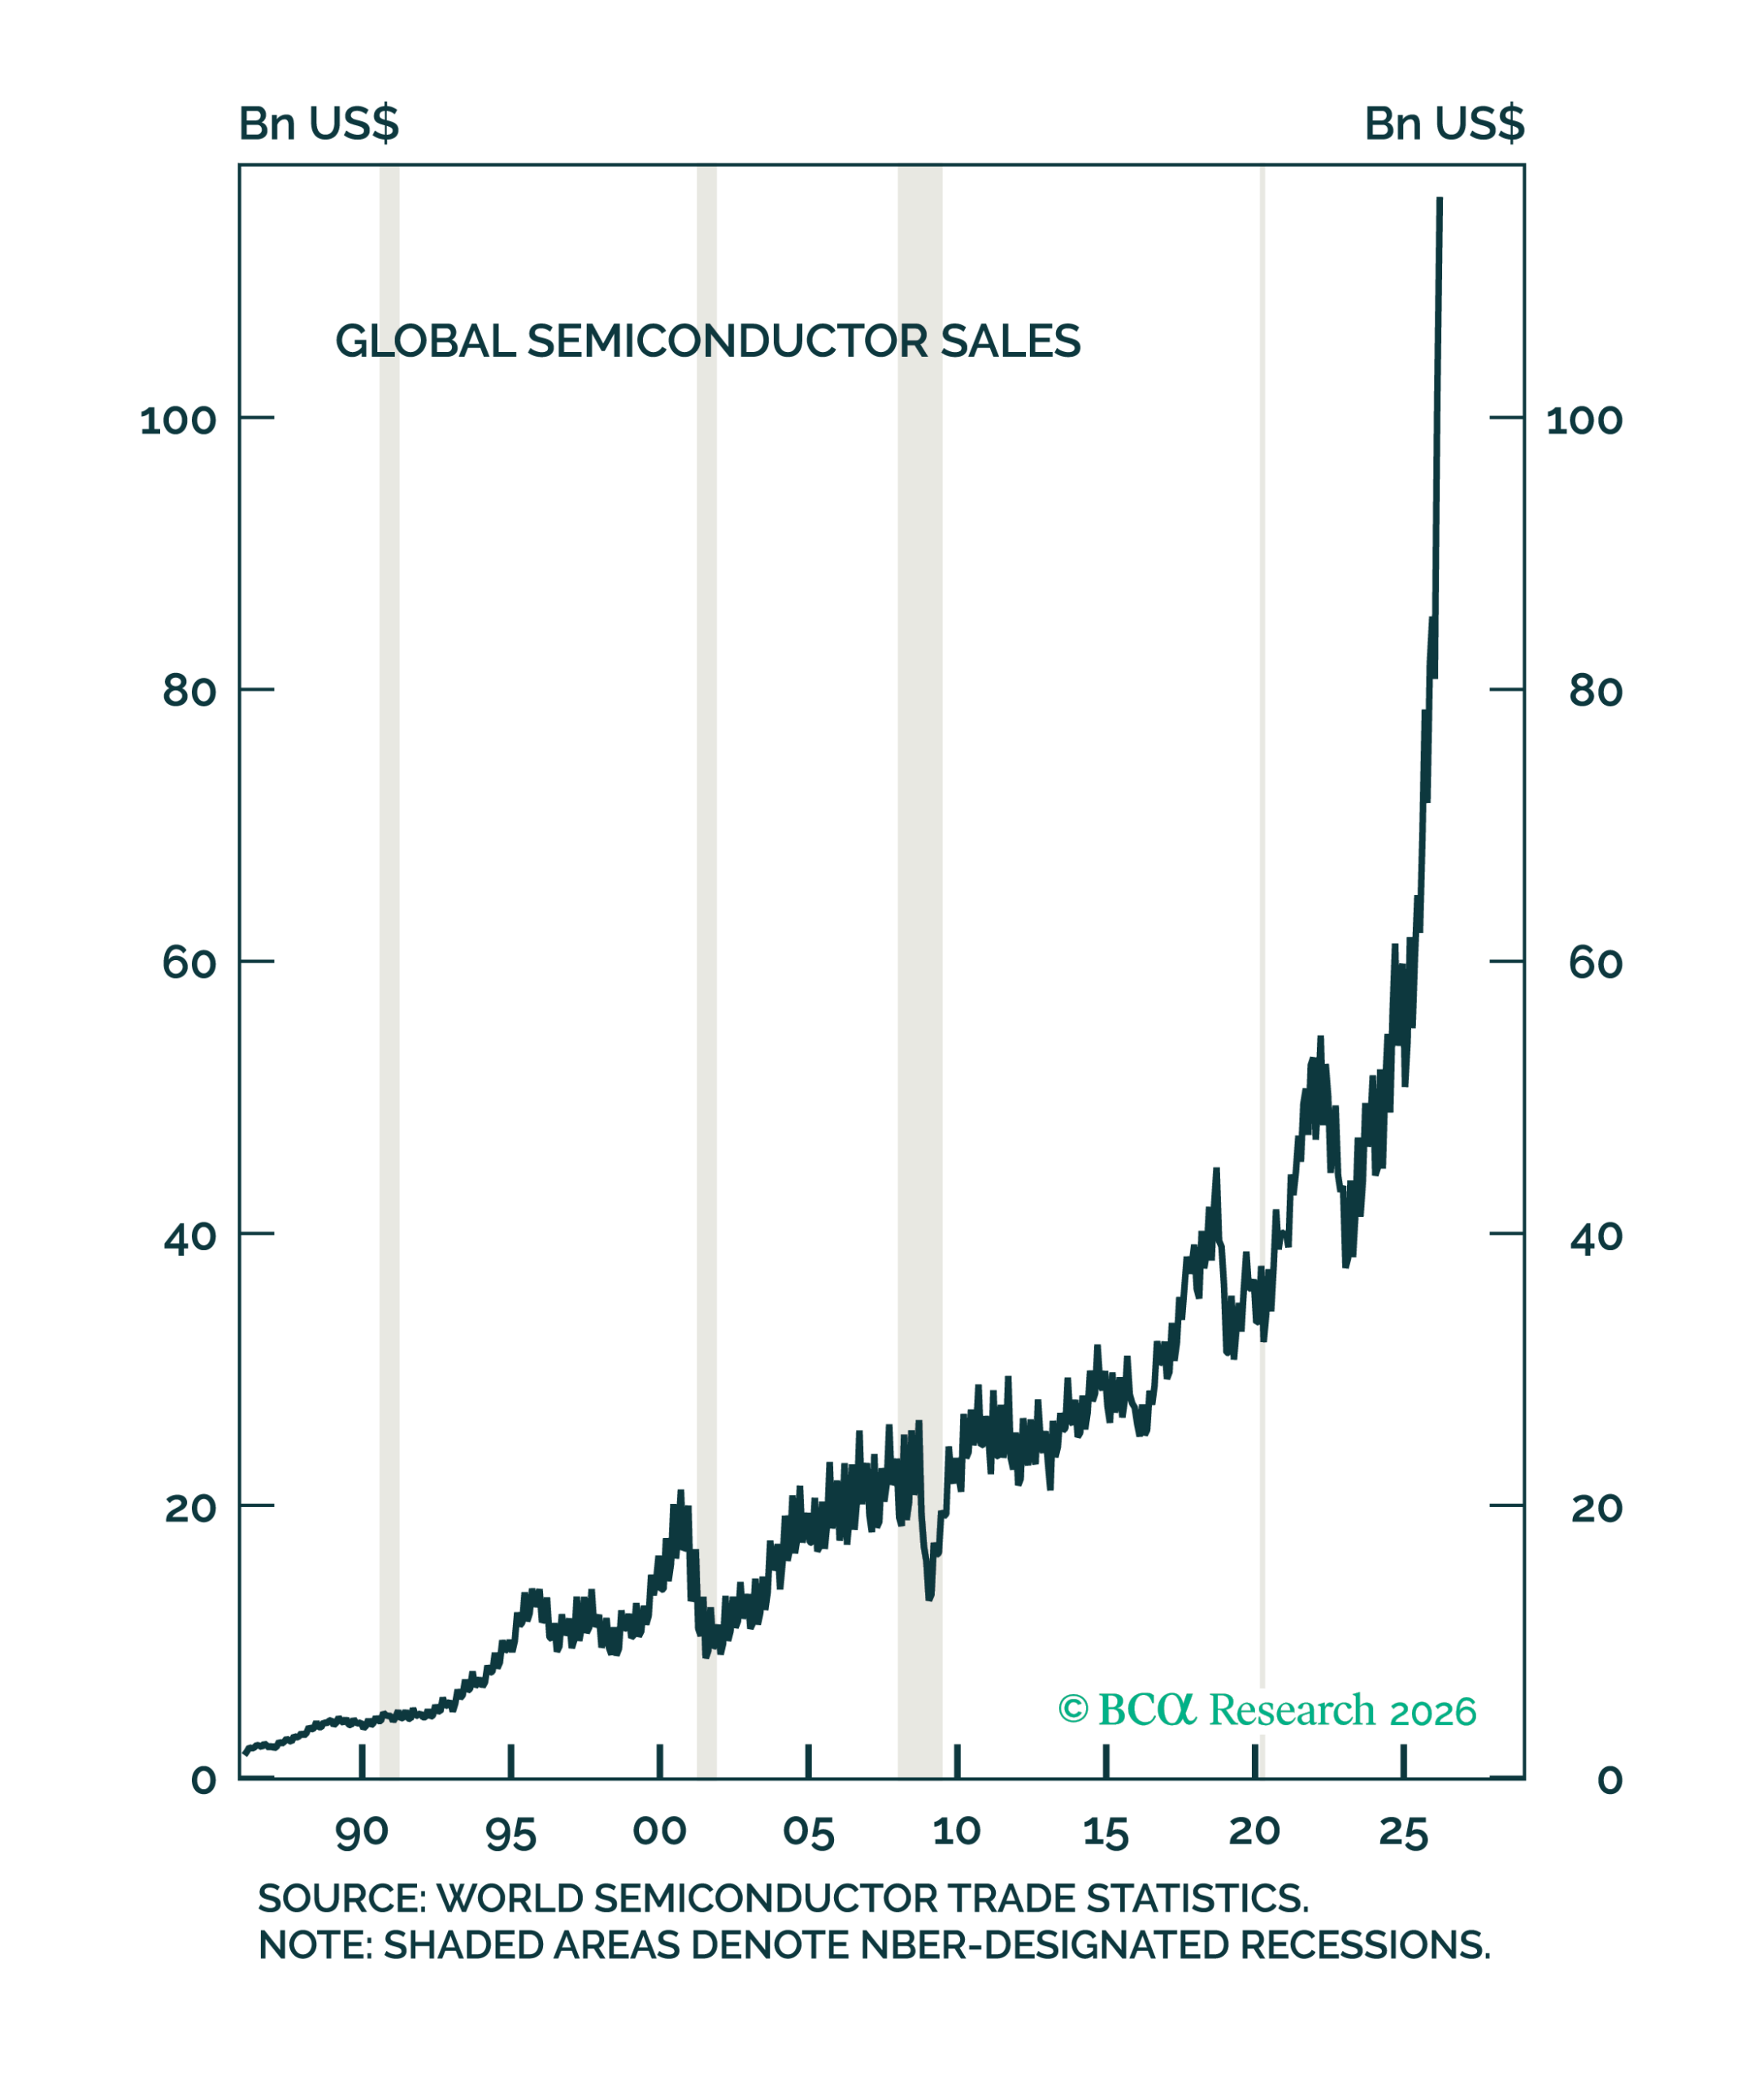
Figure 7 – Semiconductor sales have reached the stratosphere
Today: We are in a boom phase that puts all prior cycles to shame. In Q1 this year, global semiconductor sales were roughly twice the level seen just two years earlier – see Figure 7. The prevailing logic behind this is the structural deficit in supply versus demand. Given scarcity as the ultimate source of value (profit), the shortage of compute has sent S&P 500 earnings to elevated levels. However, an additional, amplifying factor lies in the accounting treatment. AI hardware producers such as Nvidia are recognising substantial profits on hardware sales, while the customers (namely the hyperscalers) are largely capitalising these purchases as capital expenditures (“capex”). While this does not change aggregate cash flows, it has mechanically inflated accrual earnings. The result is a paradox: Hyperscaler free cash flow is deteriorating sharply and could turn negative by 2027, even as reported profits surge – see Figure 8.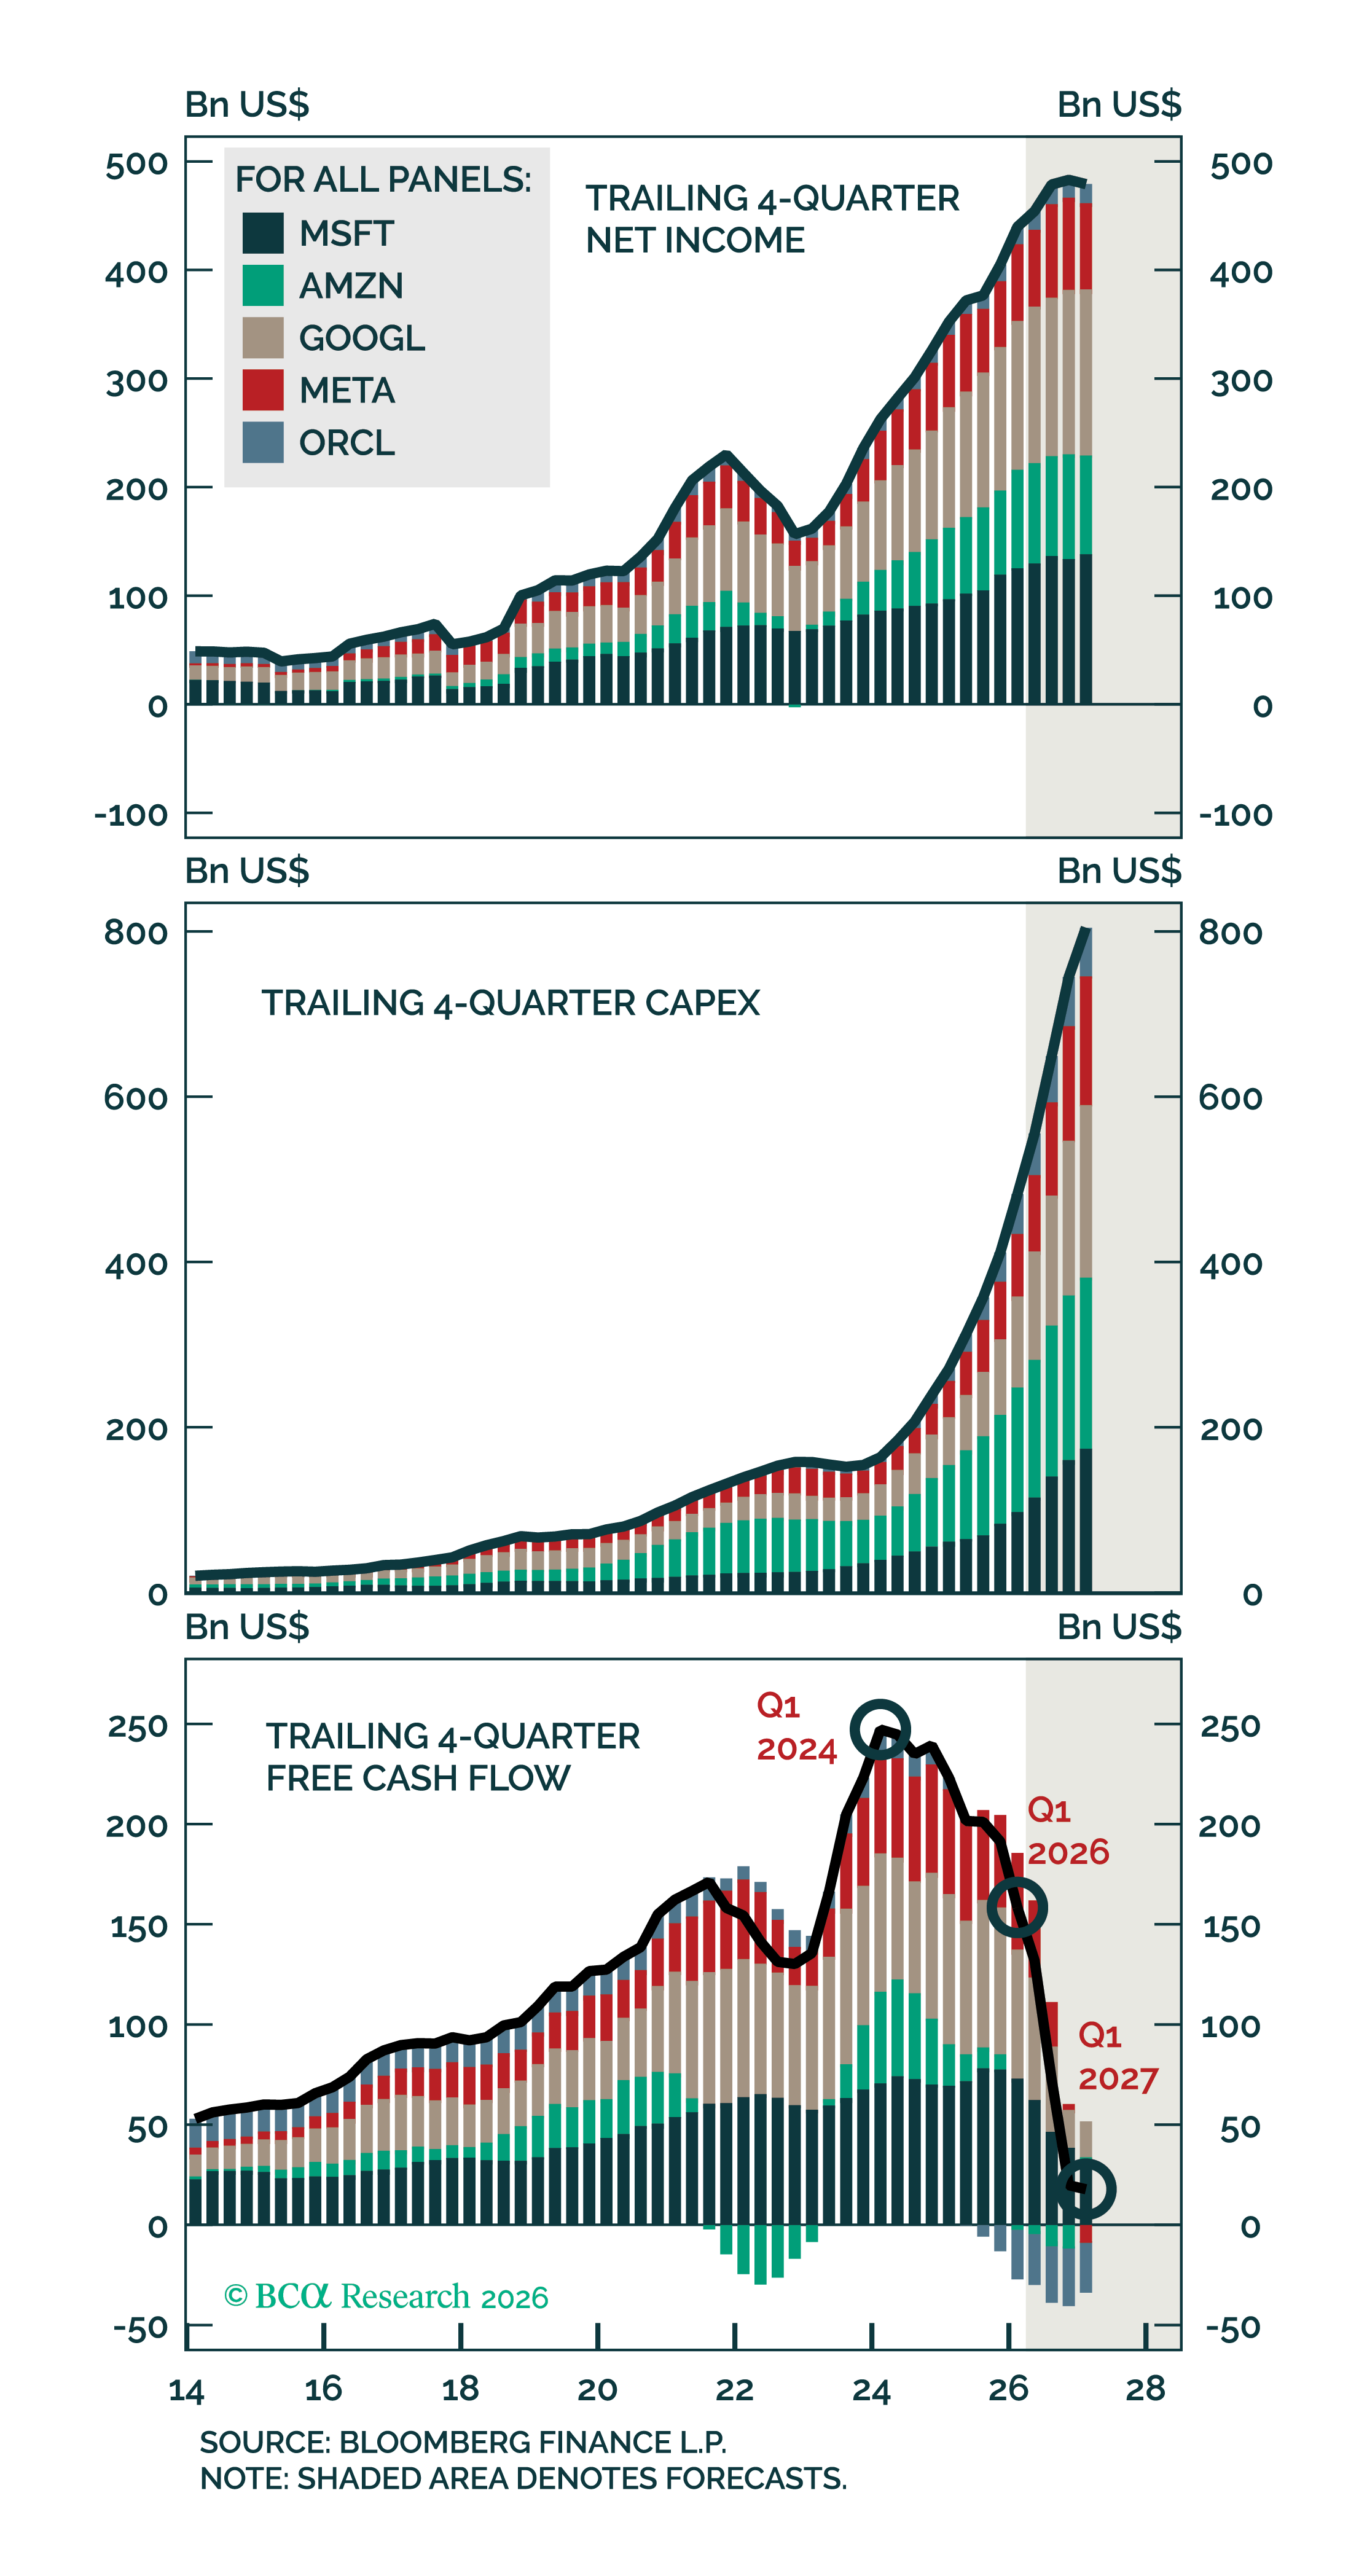
Figure 8 – Increased capex has put hyperscalers’ free cash flow in a downward spiral
The structural argument
Historically, earnings bubbles have tended to unwind as the underlying boom was revealed to be cyclical in nature, a pattern clearly visible in prior semiconductor cycles. What some investor circles argue is different this time is that the current expansion is not purely cyclical, but increasingly structural in character, potentially altering the traditional boom–bust dynamic. This is particularly evident in the memory sector, where a UBS analyst recently tripled his price target for Micron, underscoring the market’s belief in a structural trade, not a purely cyclical one.
Regardless of the structural undertones, a buildout scenario has to exhibit some degree of boom-bust by theory. The key question is what ultimately causes such a cycle to turn. AI indicators allude to the fact that while the bubble bursting may not be imminent, there could likely be a change in the underlying winners. So far most value in the AI ecosystem has been accrued by the chip layer. As model providers shift to usage-based pricing, value will begin to accrue to the application and model layers.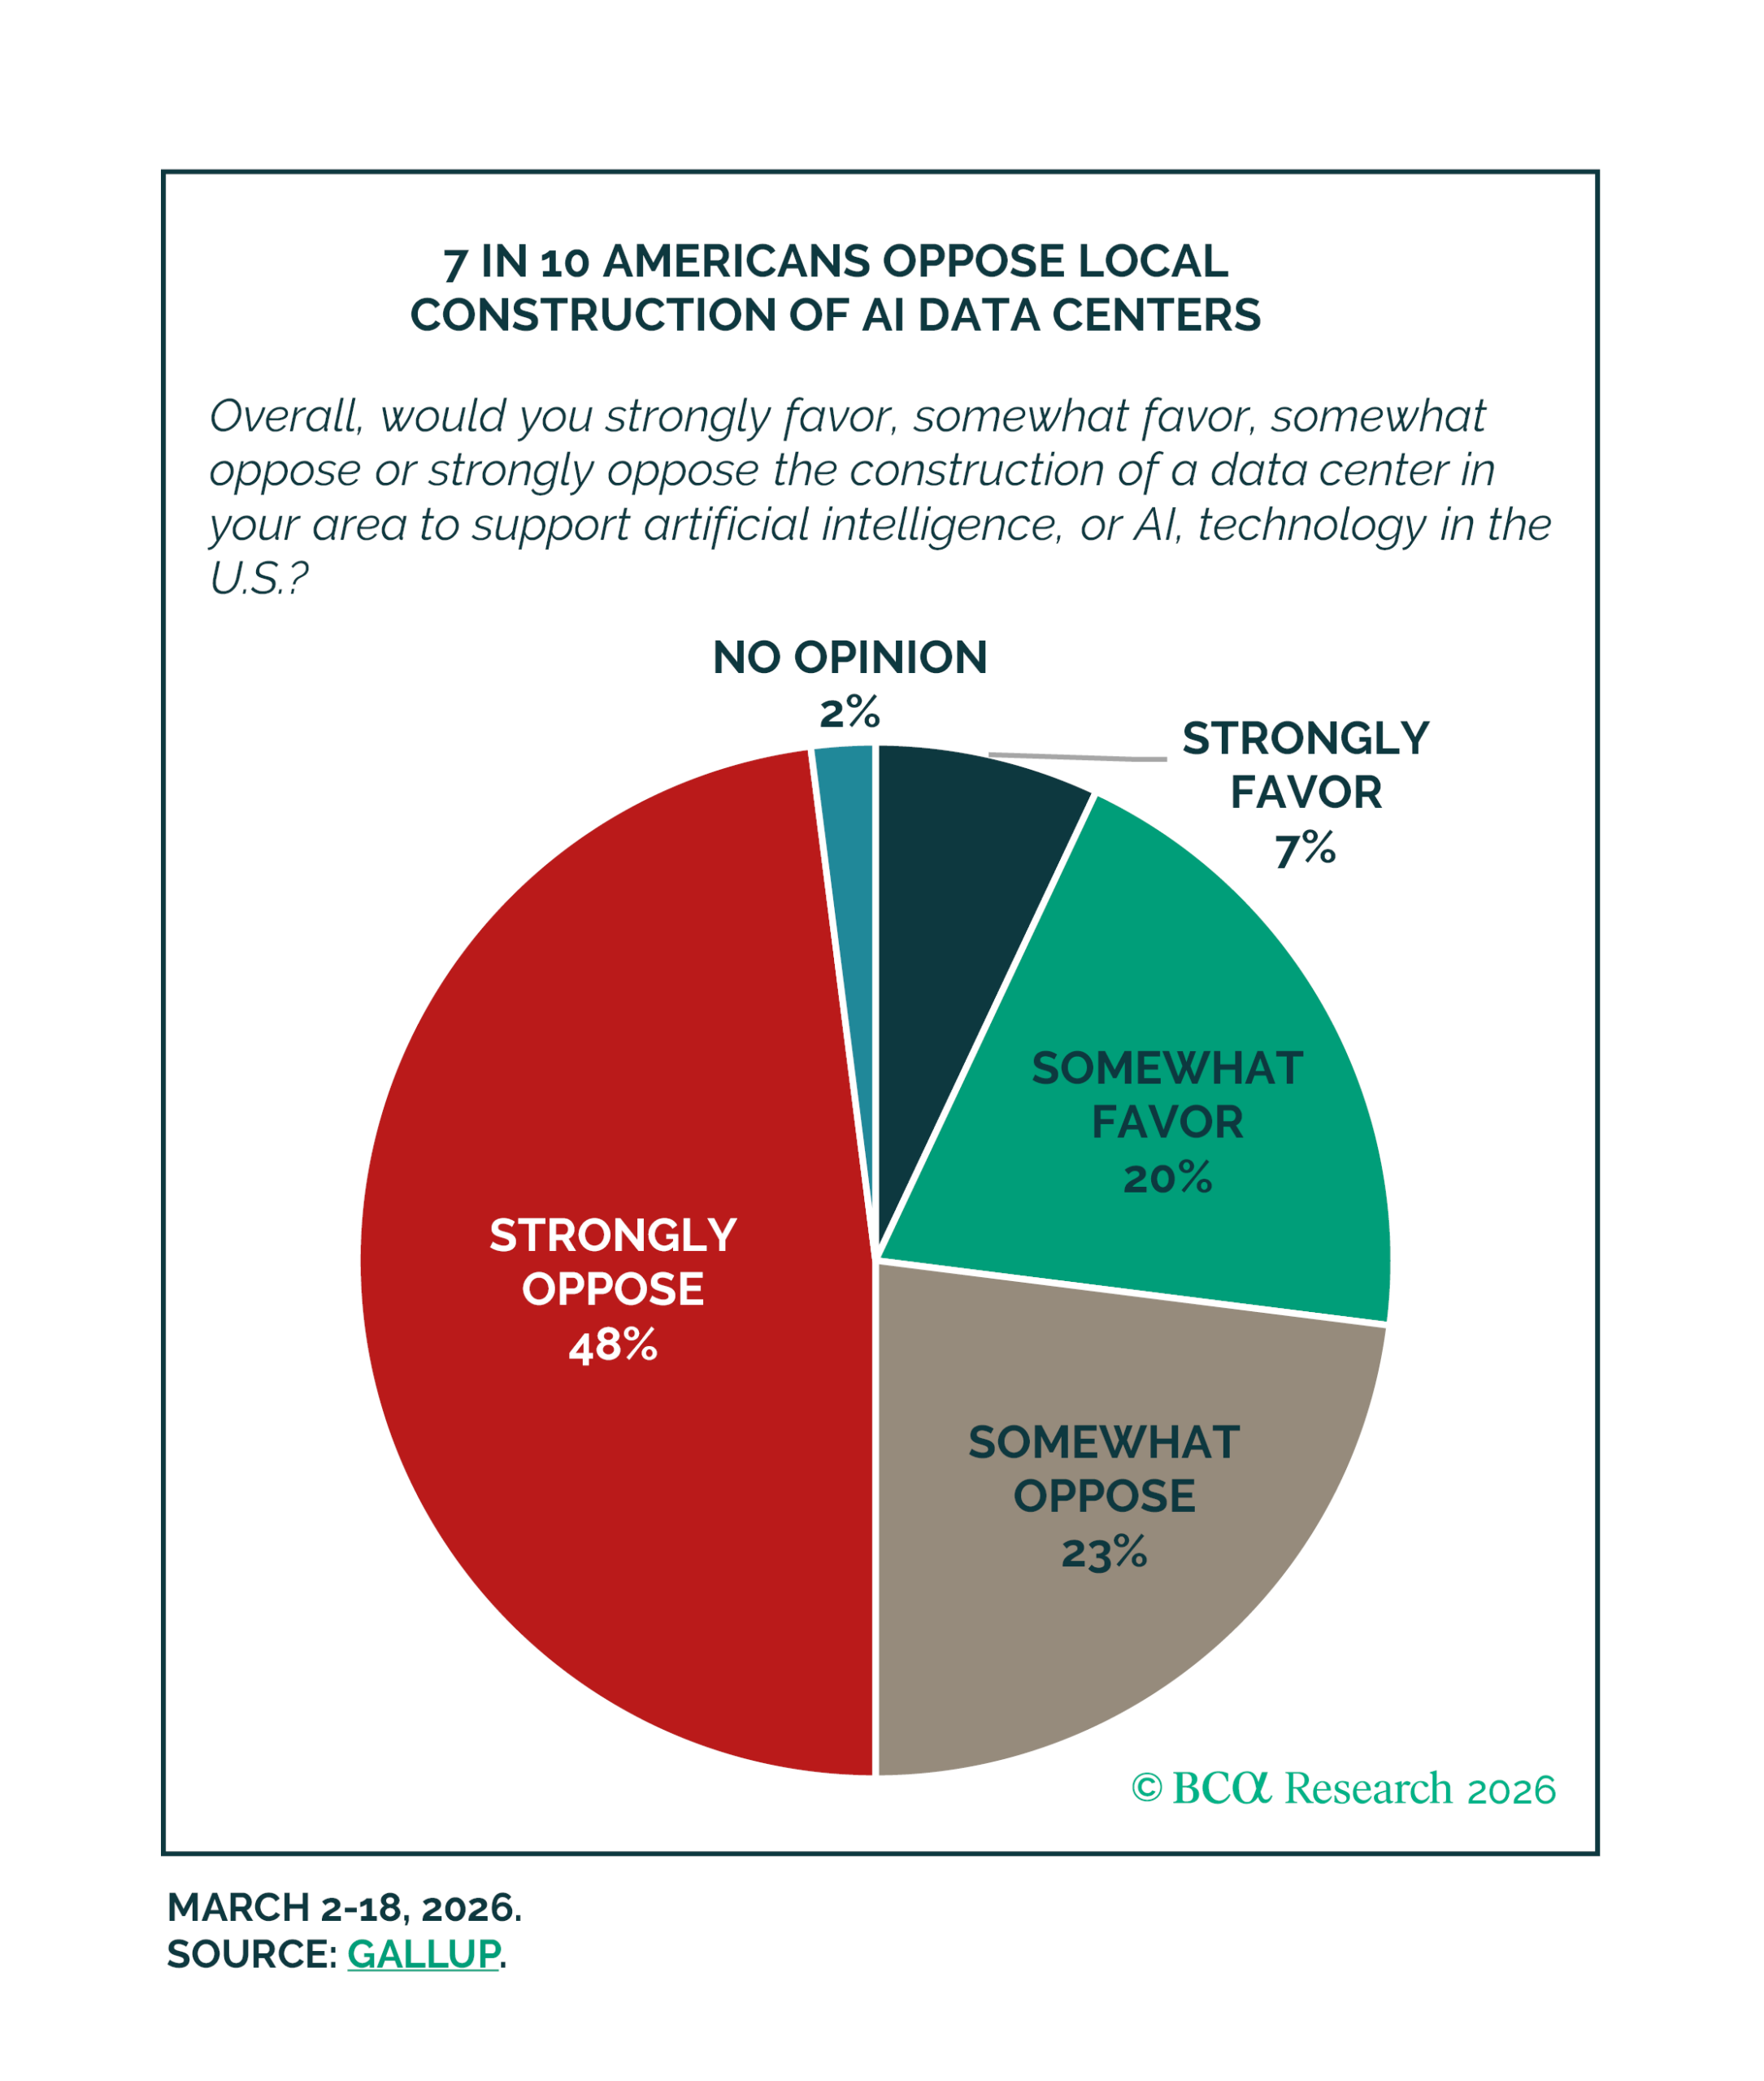
Figure 9 – No one wants to live next to a datacentre
Hyperscalers, who have mostly missed out on the exponential gains enjoyed by semiconductors, may stand to benefit on both the top and bottom line given the context of growing public opposition to a datacentre buildout. According to a recent Gallup poll, 7 in 10 Americans oppose building datacentres in their local area, with almost half expressing strong opposition – see Figure 9. In the event of a regulatory blockade, slower datacentre construction would soften the “arms race” that has caused the massive price inflation in everything from memory chips to electrical equipment, thereby boosting profit margins. Additionally, revenue will also grow as hyperscalers can leverage compute scarcity and command premium pricing for access.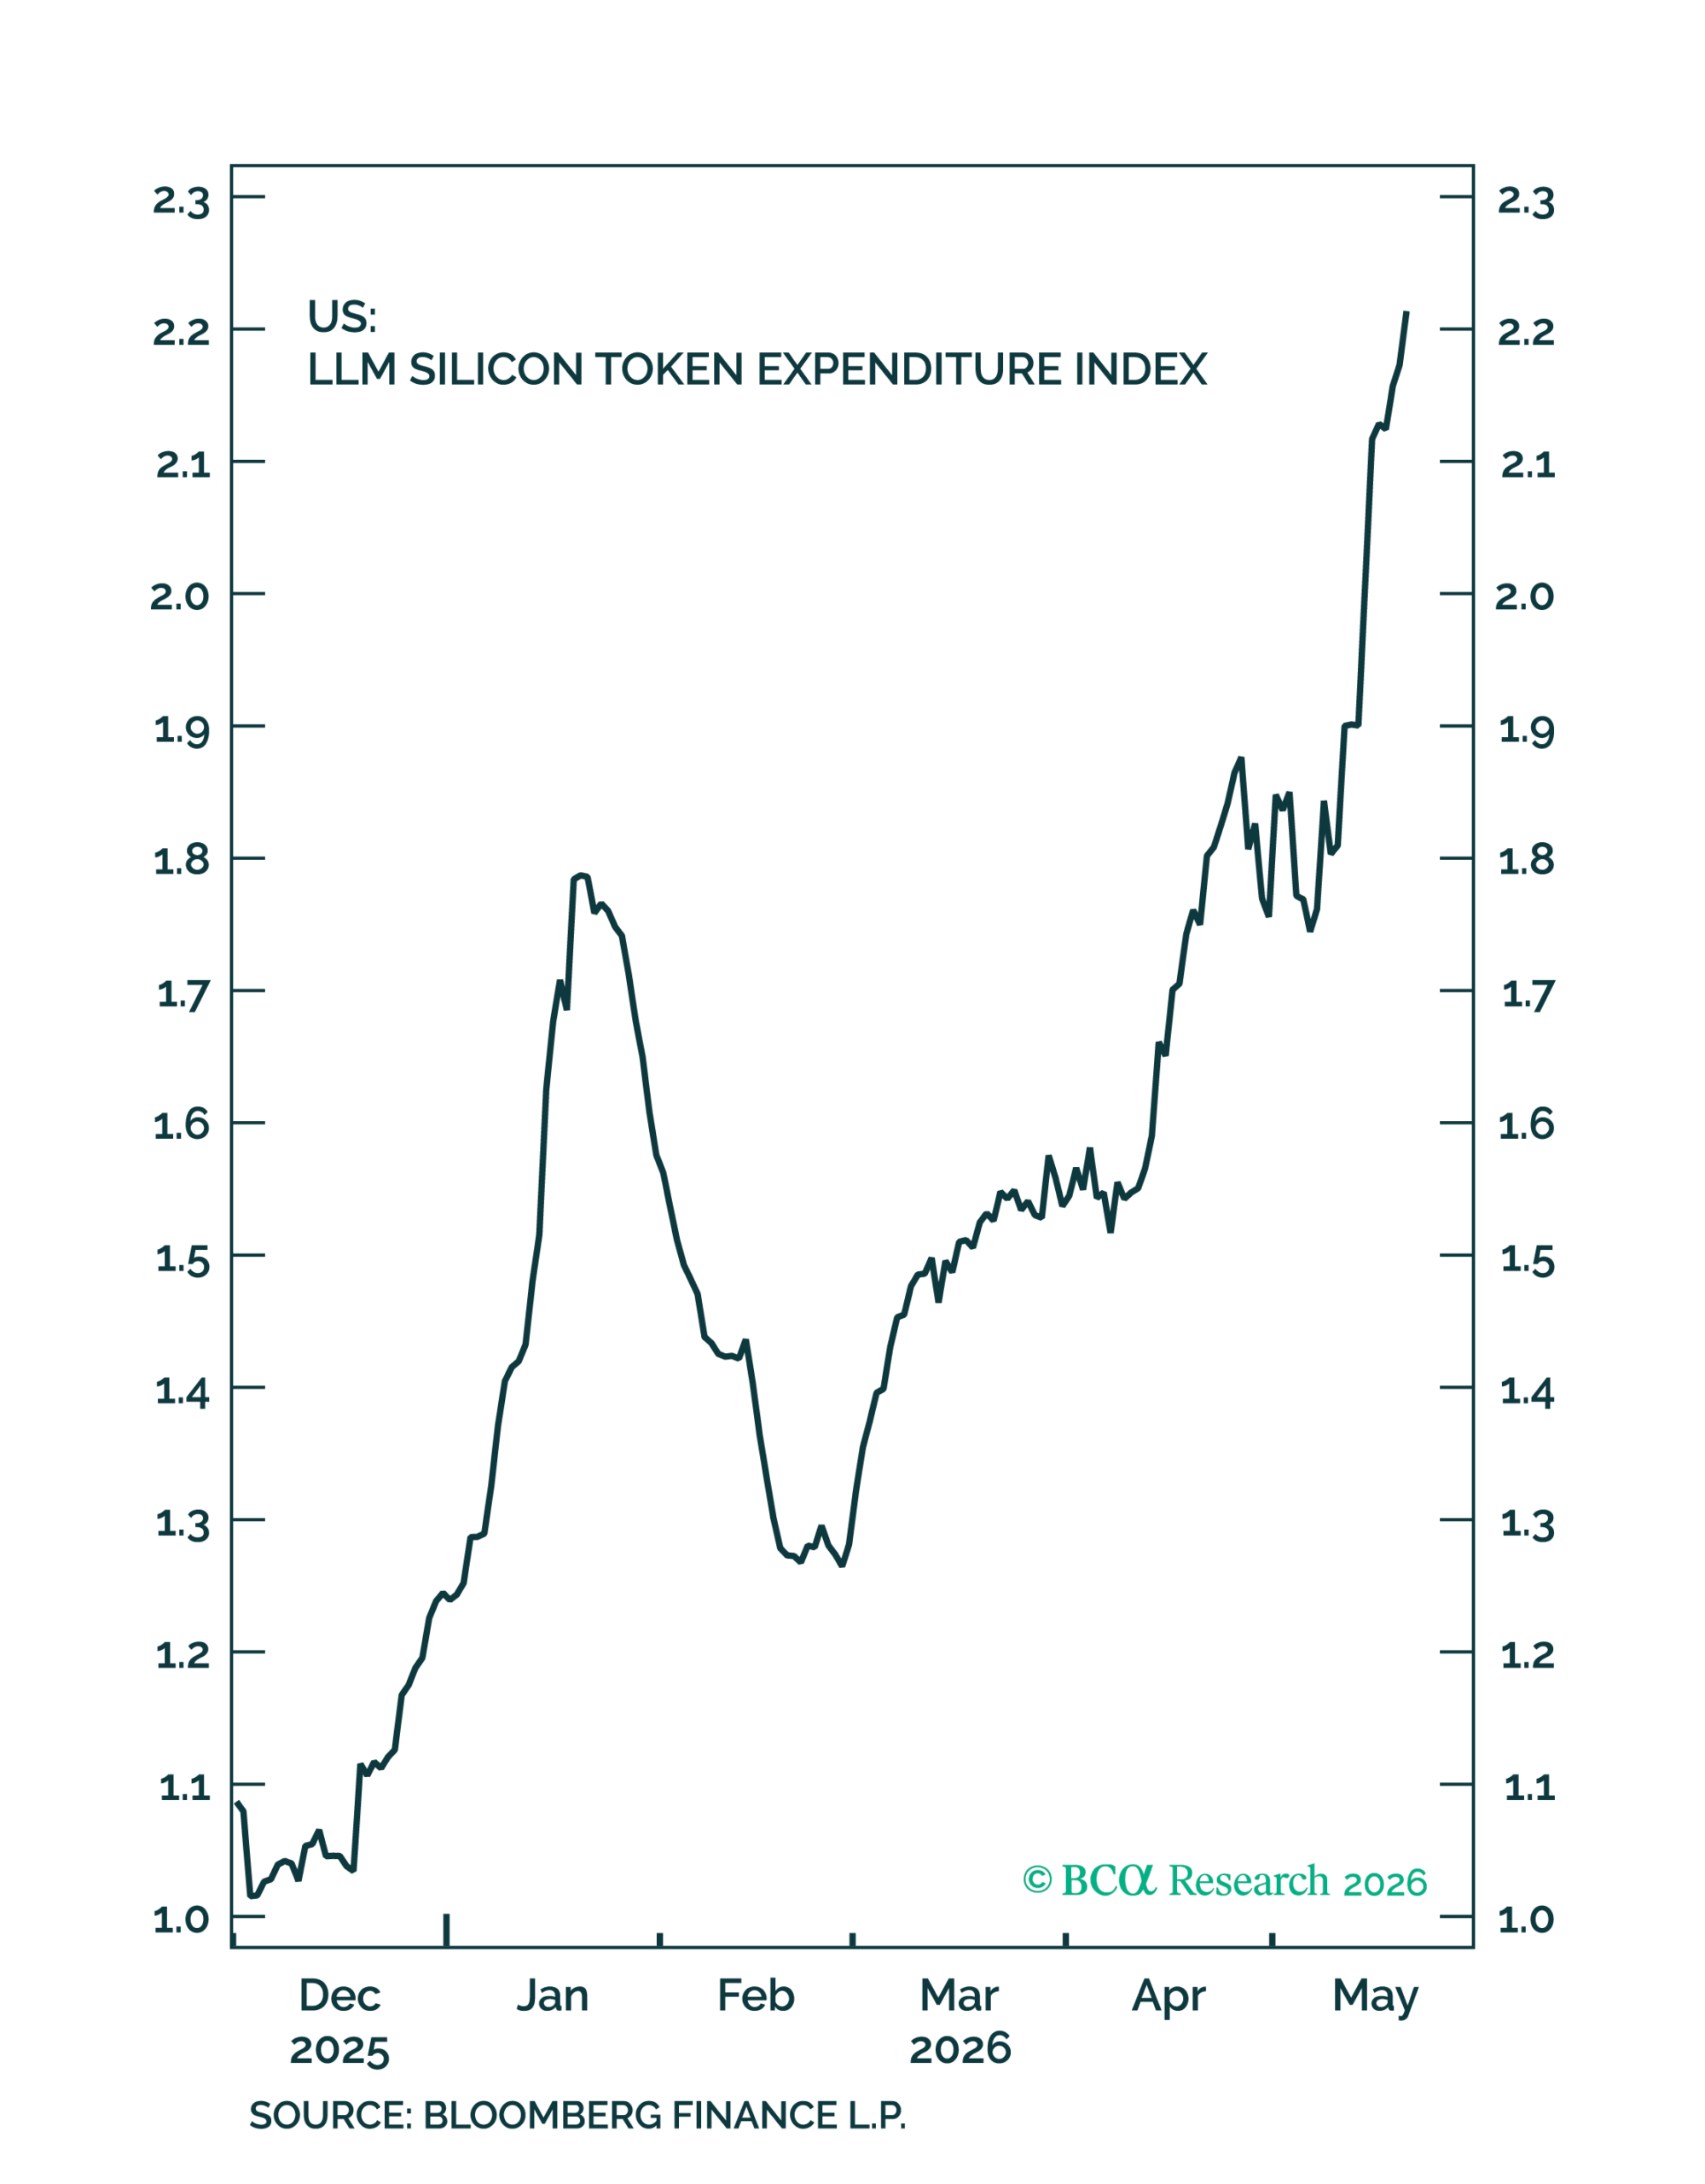
Figure 10 – With the advent of AI agents, users are opting for more expensive and advanced models
Agentic AI token cost is another indicator that supports a changing quantum in winners. Anthropic and OpenAI have metaphorically been footing the bill as a way to gain market share and more importantly, an absolute market. This is not an uncommon business model for start-up, innovating companies. A good example is Uber, who only a few years ago cornered the market with accessible, cheap, ride-hailing. This is not the norm now, with base and surge pricing increasingly predatory. The AI model builders thus cannot be expected to subside token usage forever, especially once they go public and their reliance on a “free sample” strategy is exposed in full. Even after normalising for usage, paid prices per token have already doubled since the start of the year – see Figure 10. CFOs have begun to take notice, questioning whether the exorbitant AI bills are justified. This can be a tailwind for software shares, as token cost and scarcity tempers the argument that the software premium is obsolete. Over the last month, the sector has already seen an admirable recovery from their software-recession lows.
Investment takeaway
Earnings bubbles may be more economically damaging than valuation bubbles if they leave behind significant excess capacity. In the US, combined software and hardware investment has reached a record 4.9% of GDP in Q1 2026, so any slowdown in tech capex could materially reduce aggregate demand.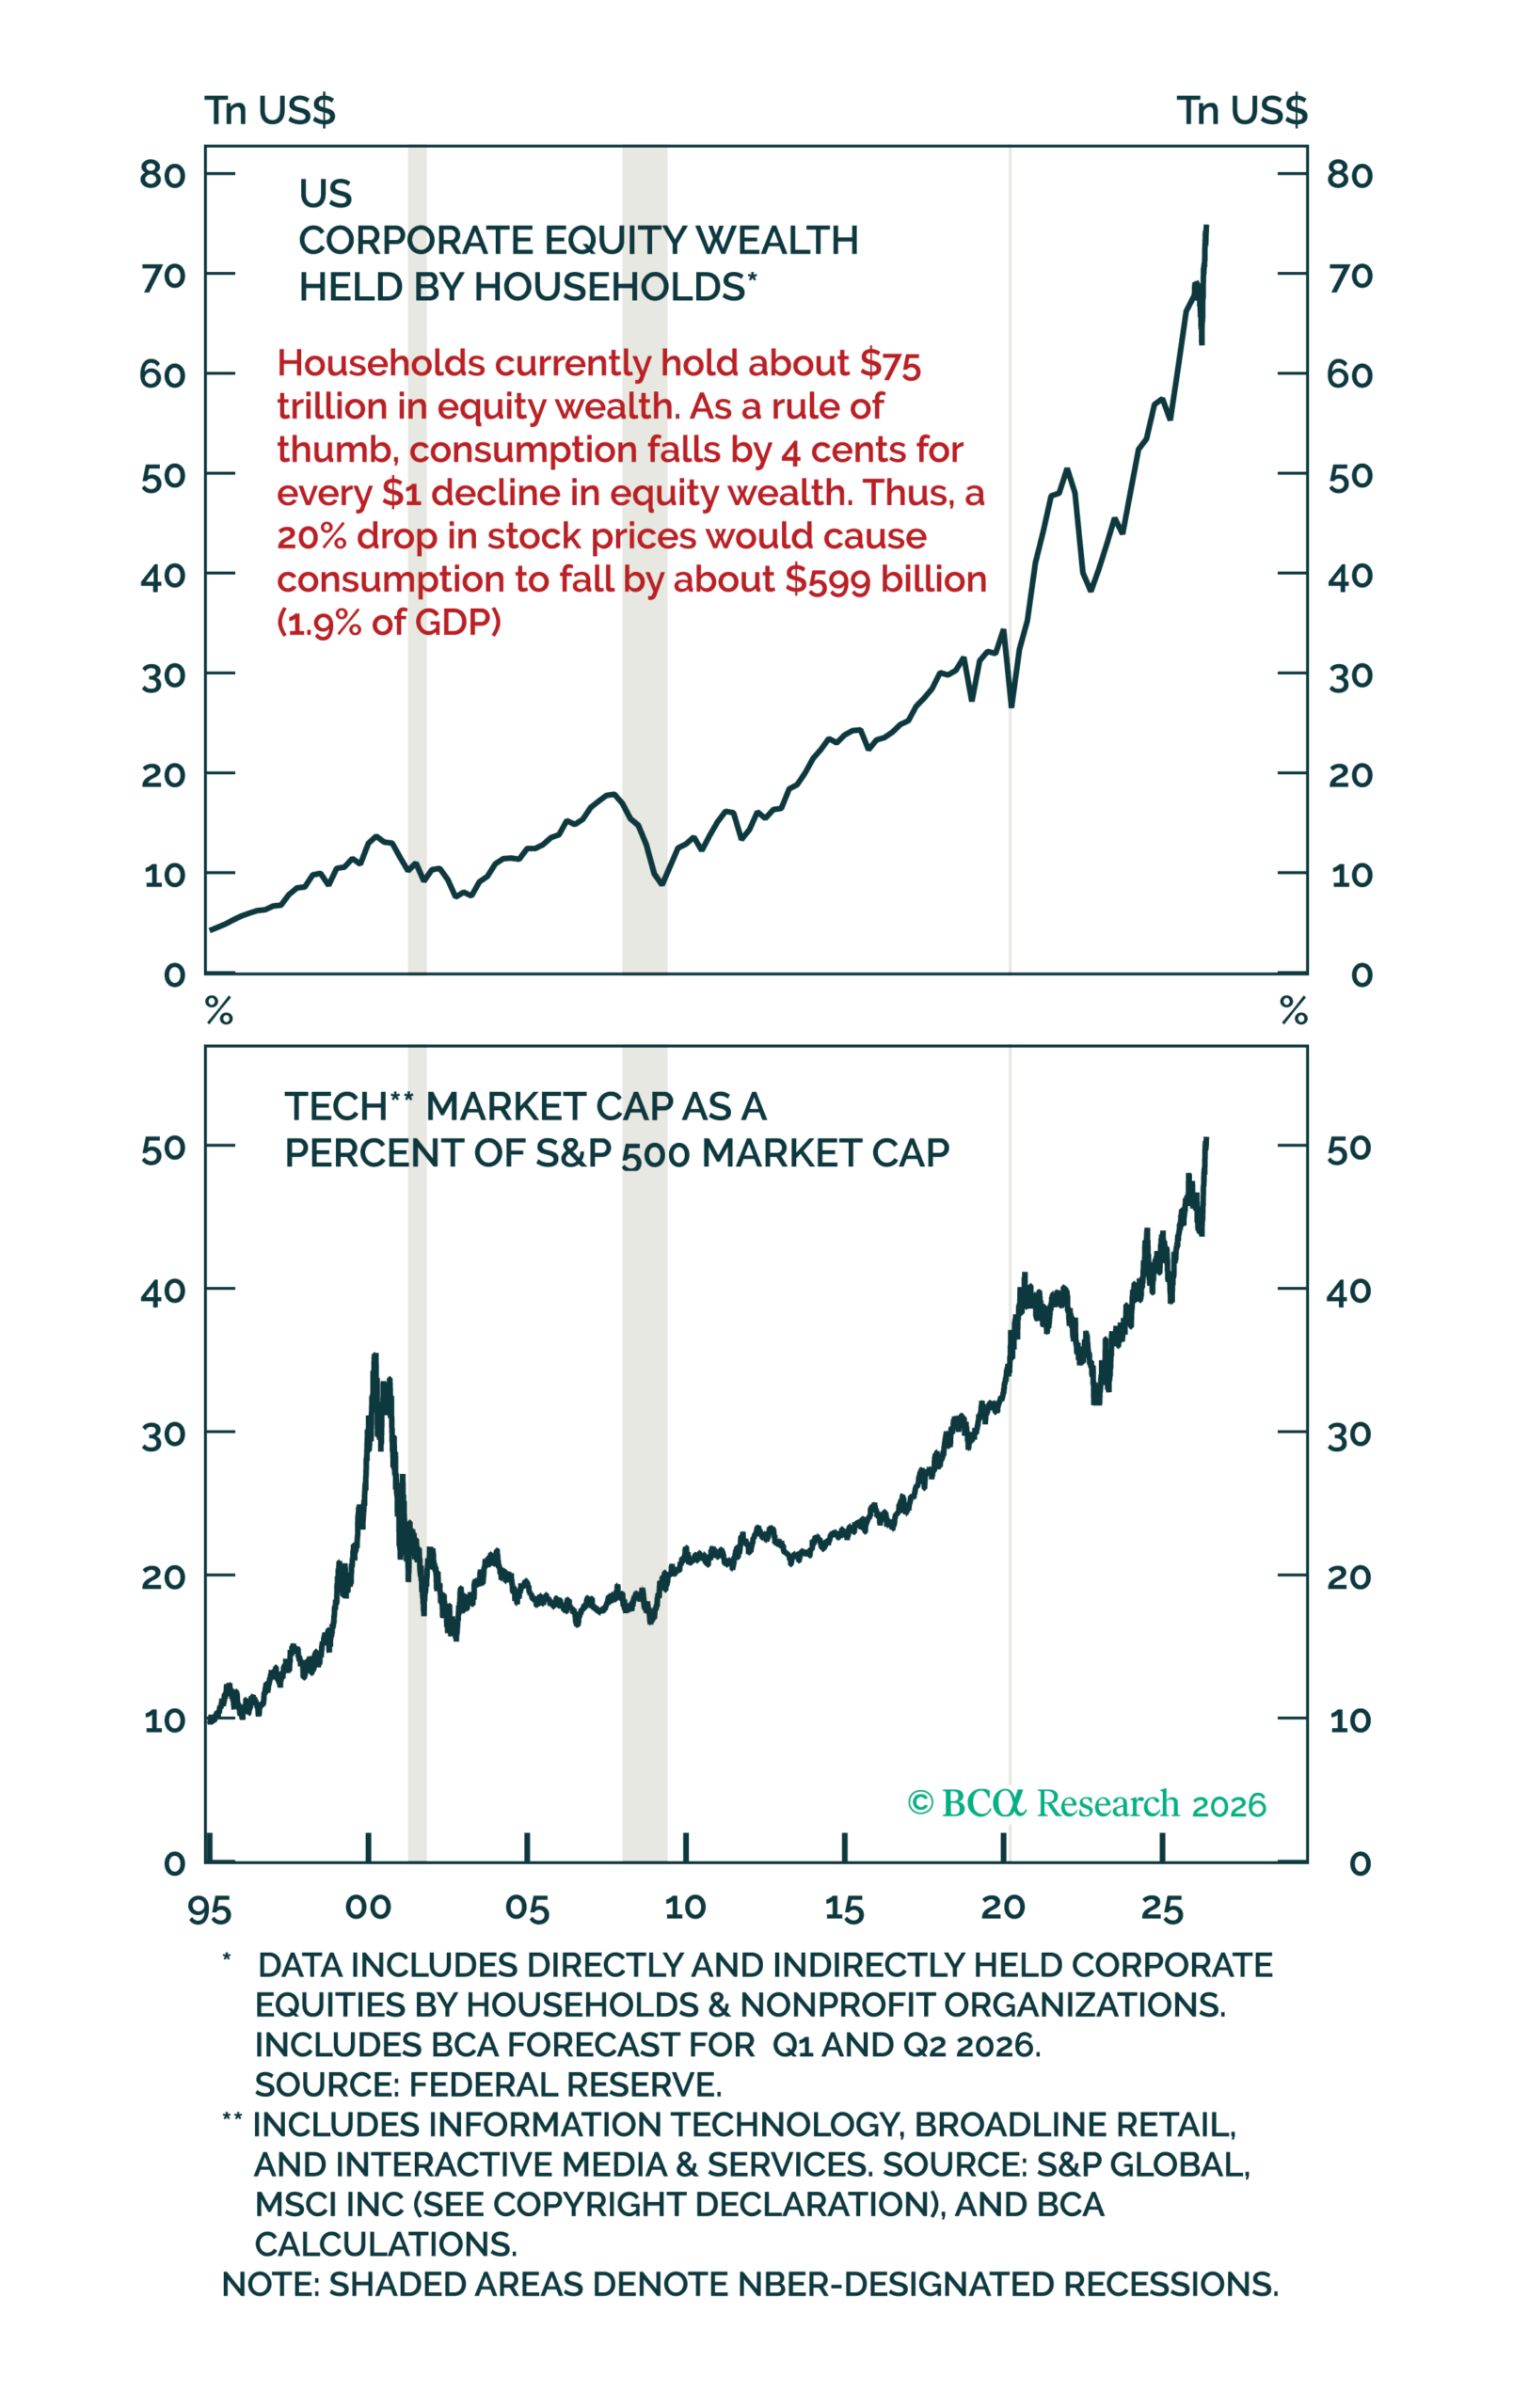
Figure 11 – The bursting of the AI bubble will lead to a negative wealth effect
A rule of thumb states that every $1 decline in equity wealth reduces consumer spending by about four cents. On this basis, a 20% fall in share market wealth could cut US consumption by roughly 2.7%, or 1.9% of GDP. The impact would fall disproportionately on higher-income households that own most equities, at a time when lower-income households are already under pressure from weak real income growth, depleted savings, and rising delinquencies. Higher gasoline prices have continued to exacerbate this divide.
If you are interested in finding out more about how cognisance of the macroeconomic backdrop impacts our investment decision making process, connect with Integrity Asset Management and let us help you navigate your investing journey.
For more information on this synopsis or to discuss solutions provided by Integrity Asset Management, please contact us at:
Tel: (021) 671 2112
Cell: 072 513 2684 / 084 601 1025
E-mail: nic@integrityam.co.za / herman@integrityam.co.za
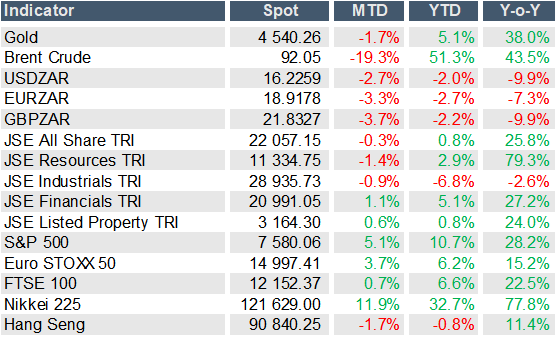
Source: Bloomberg, 31 May 2026