
One shock, many responses
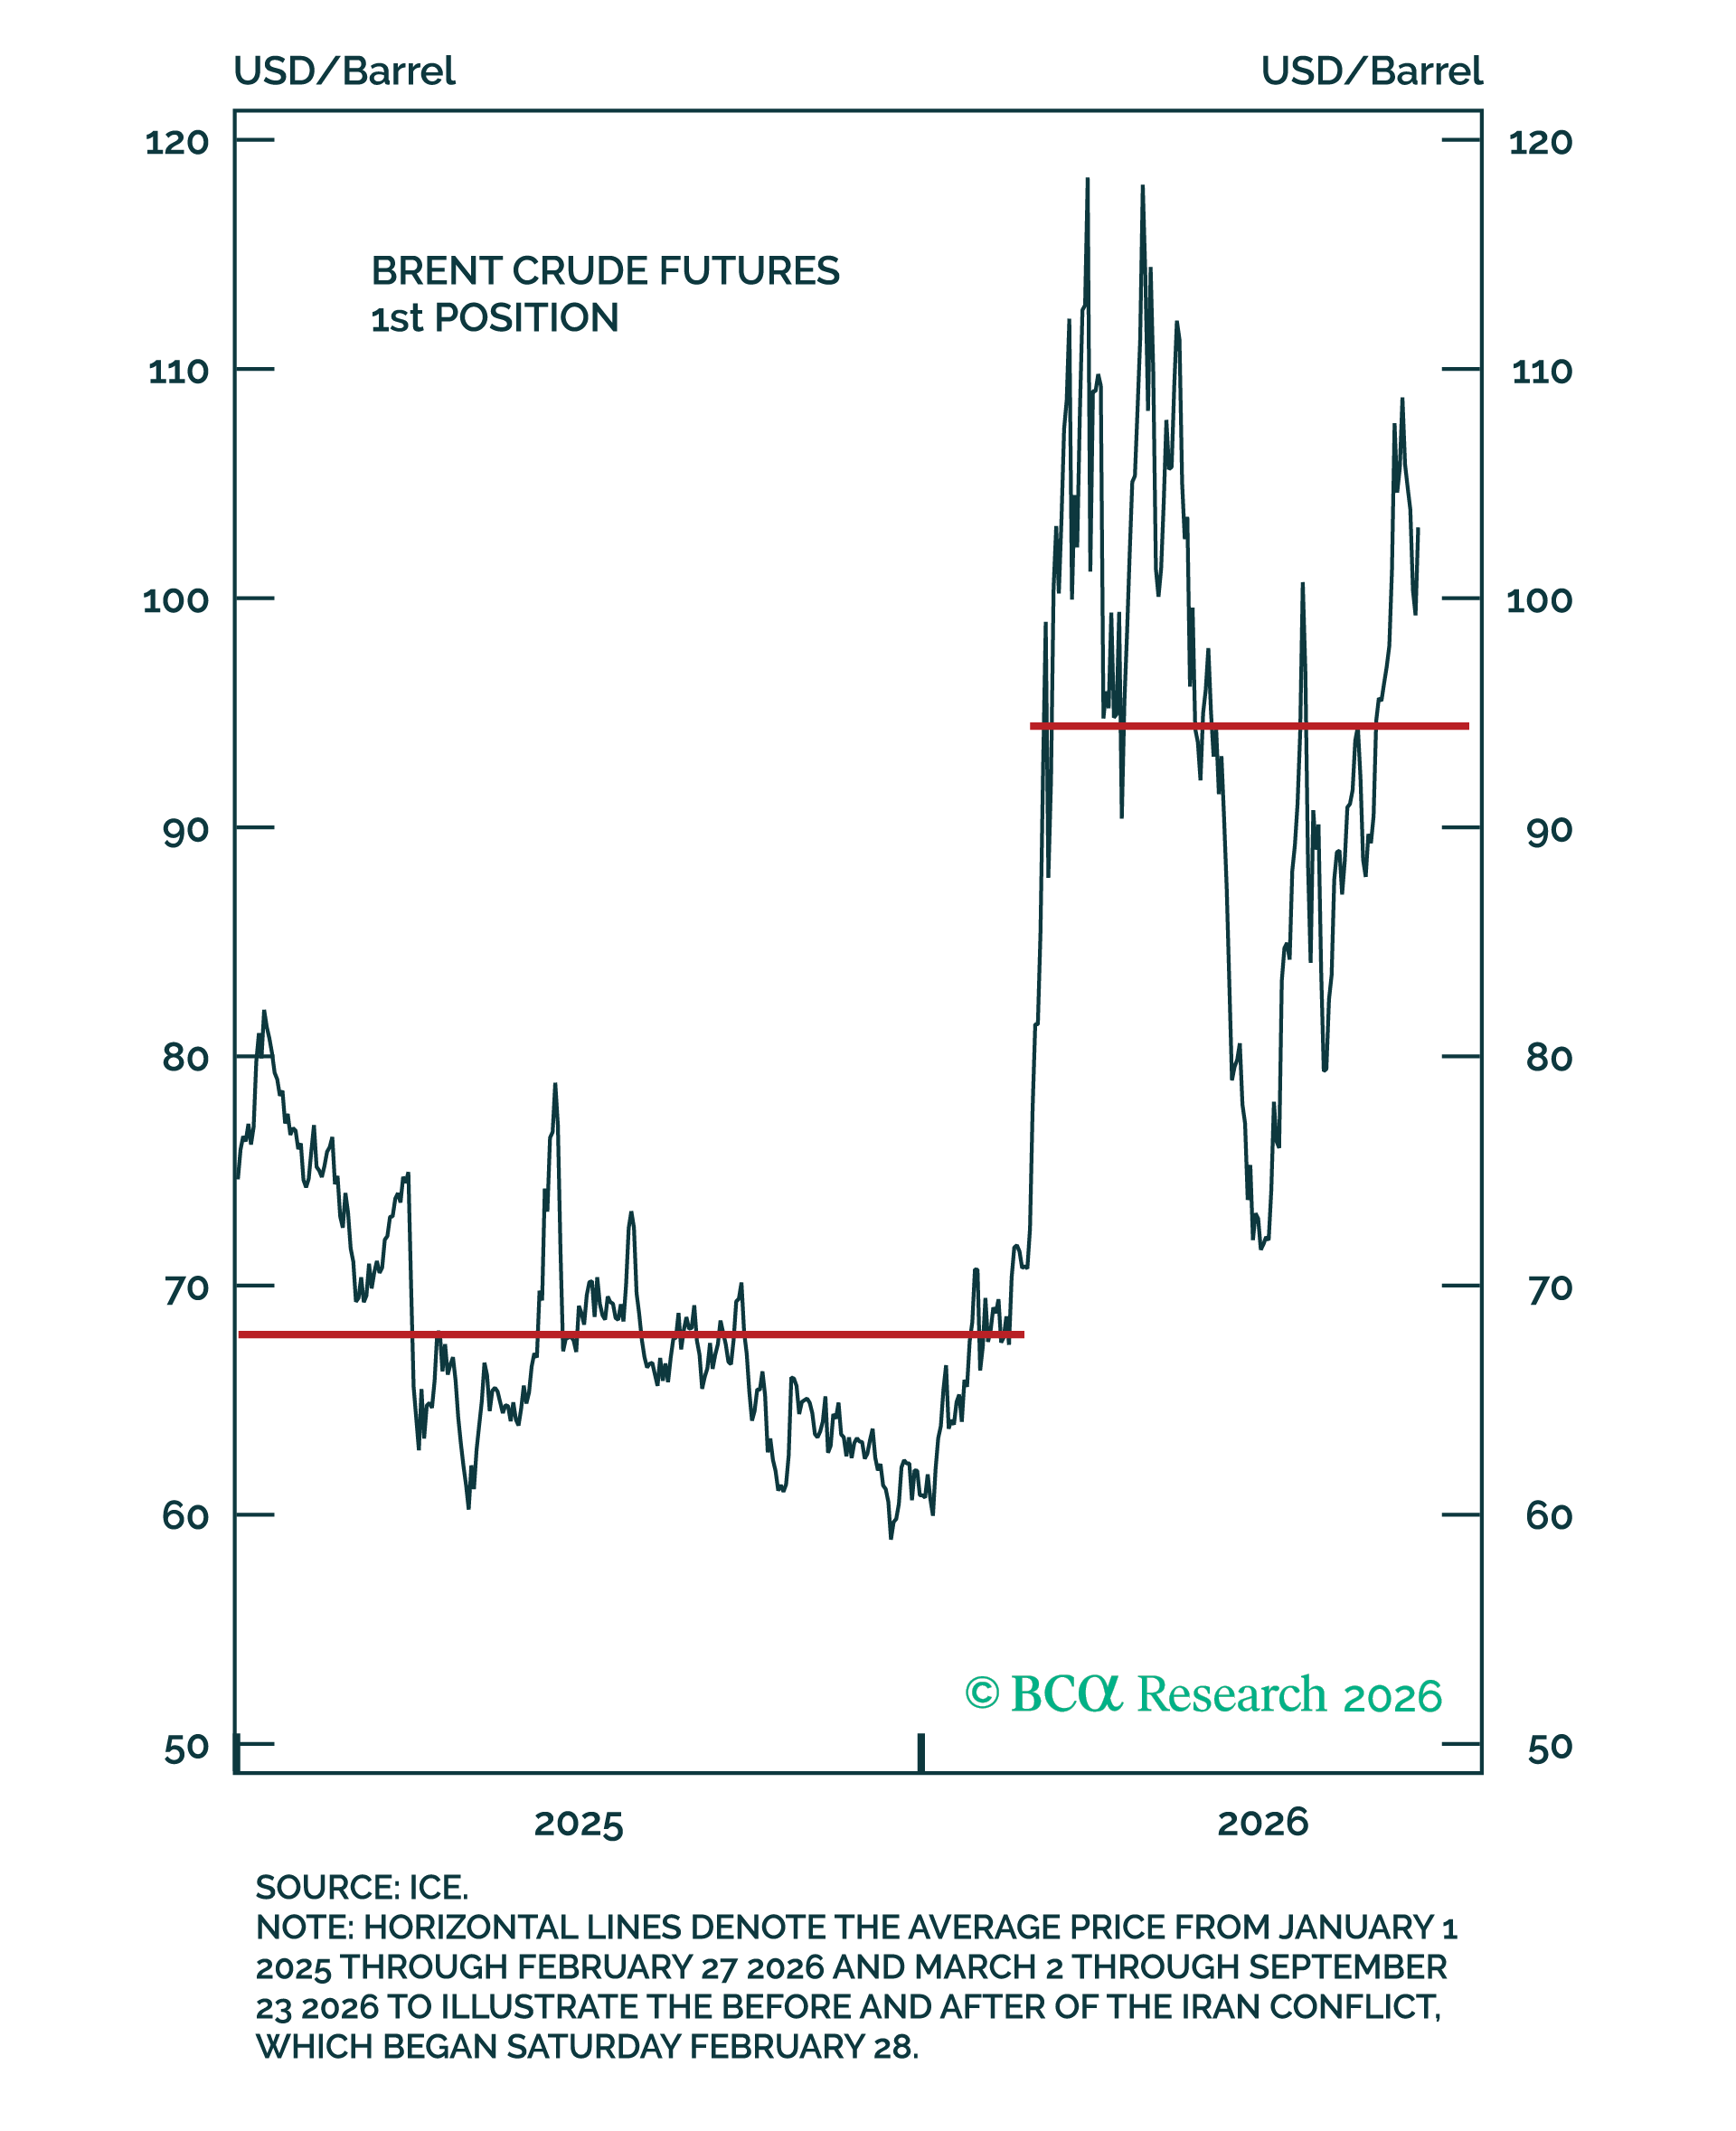
Figure 1 – Brent is 40% above pre-conflict levels.
Figure 1 – Brent is 40% above pre-conflict levels.
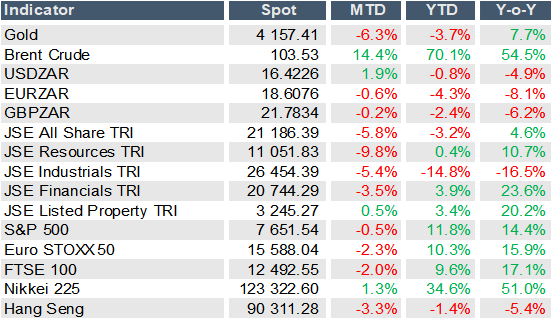
Brent crude has averaged above $94 a barrel since March, about 40% above its pre-conflict level – see Figure 1. Global shares are up nearly 14% this year and sit just below their all-time high; however, the damage has appeared in bond markets instead. Looking at sovereign ten-year bonds, yields are near 20-year highs across the G7 (Italy aside), at a 30-year high in Japan, and now crossing the 5% level in the US.
Central banks first sat out the shock, the orthodox response to a supply shock that may prove temporary. Since then, the Federal Reserve (“Fed”), European Central Bank (“ECB”) and Bank of Japan (“BoJ”) have hiked, with the Bank of England (“BoE”) and signalling that they will follow. As recently as the sixth of October, markets price about 84 basis points more from the Fed alone over the next twelve months.
Credibility, and a high bar
Despite the hawks circling the globe, hike expectations could be overestimating the inflation scare, potentially at the cost of growth. Europe is the clearest example. The ECB raised its deposit rate in June and September to 2.5% despite core inflation, which excludes energy, staying near target in nine of the last twelve months. This matters given the “second-round effects” alarm that has been raised ad nauseam: the scenario in which an energy price rise leaks into wages and services prices until what was a one-off jump becomes a trend. Whether that leak opens depends largely on whether people believe the central bank will hold inflation at 2%.
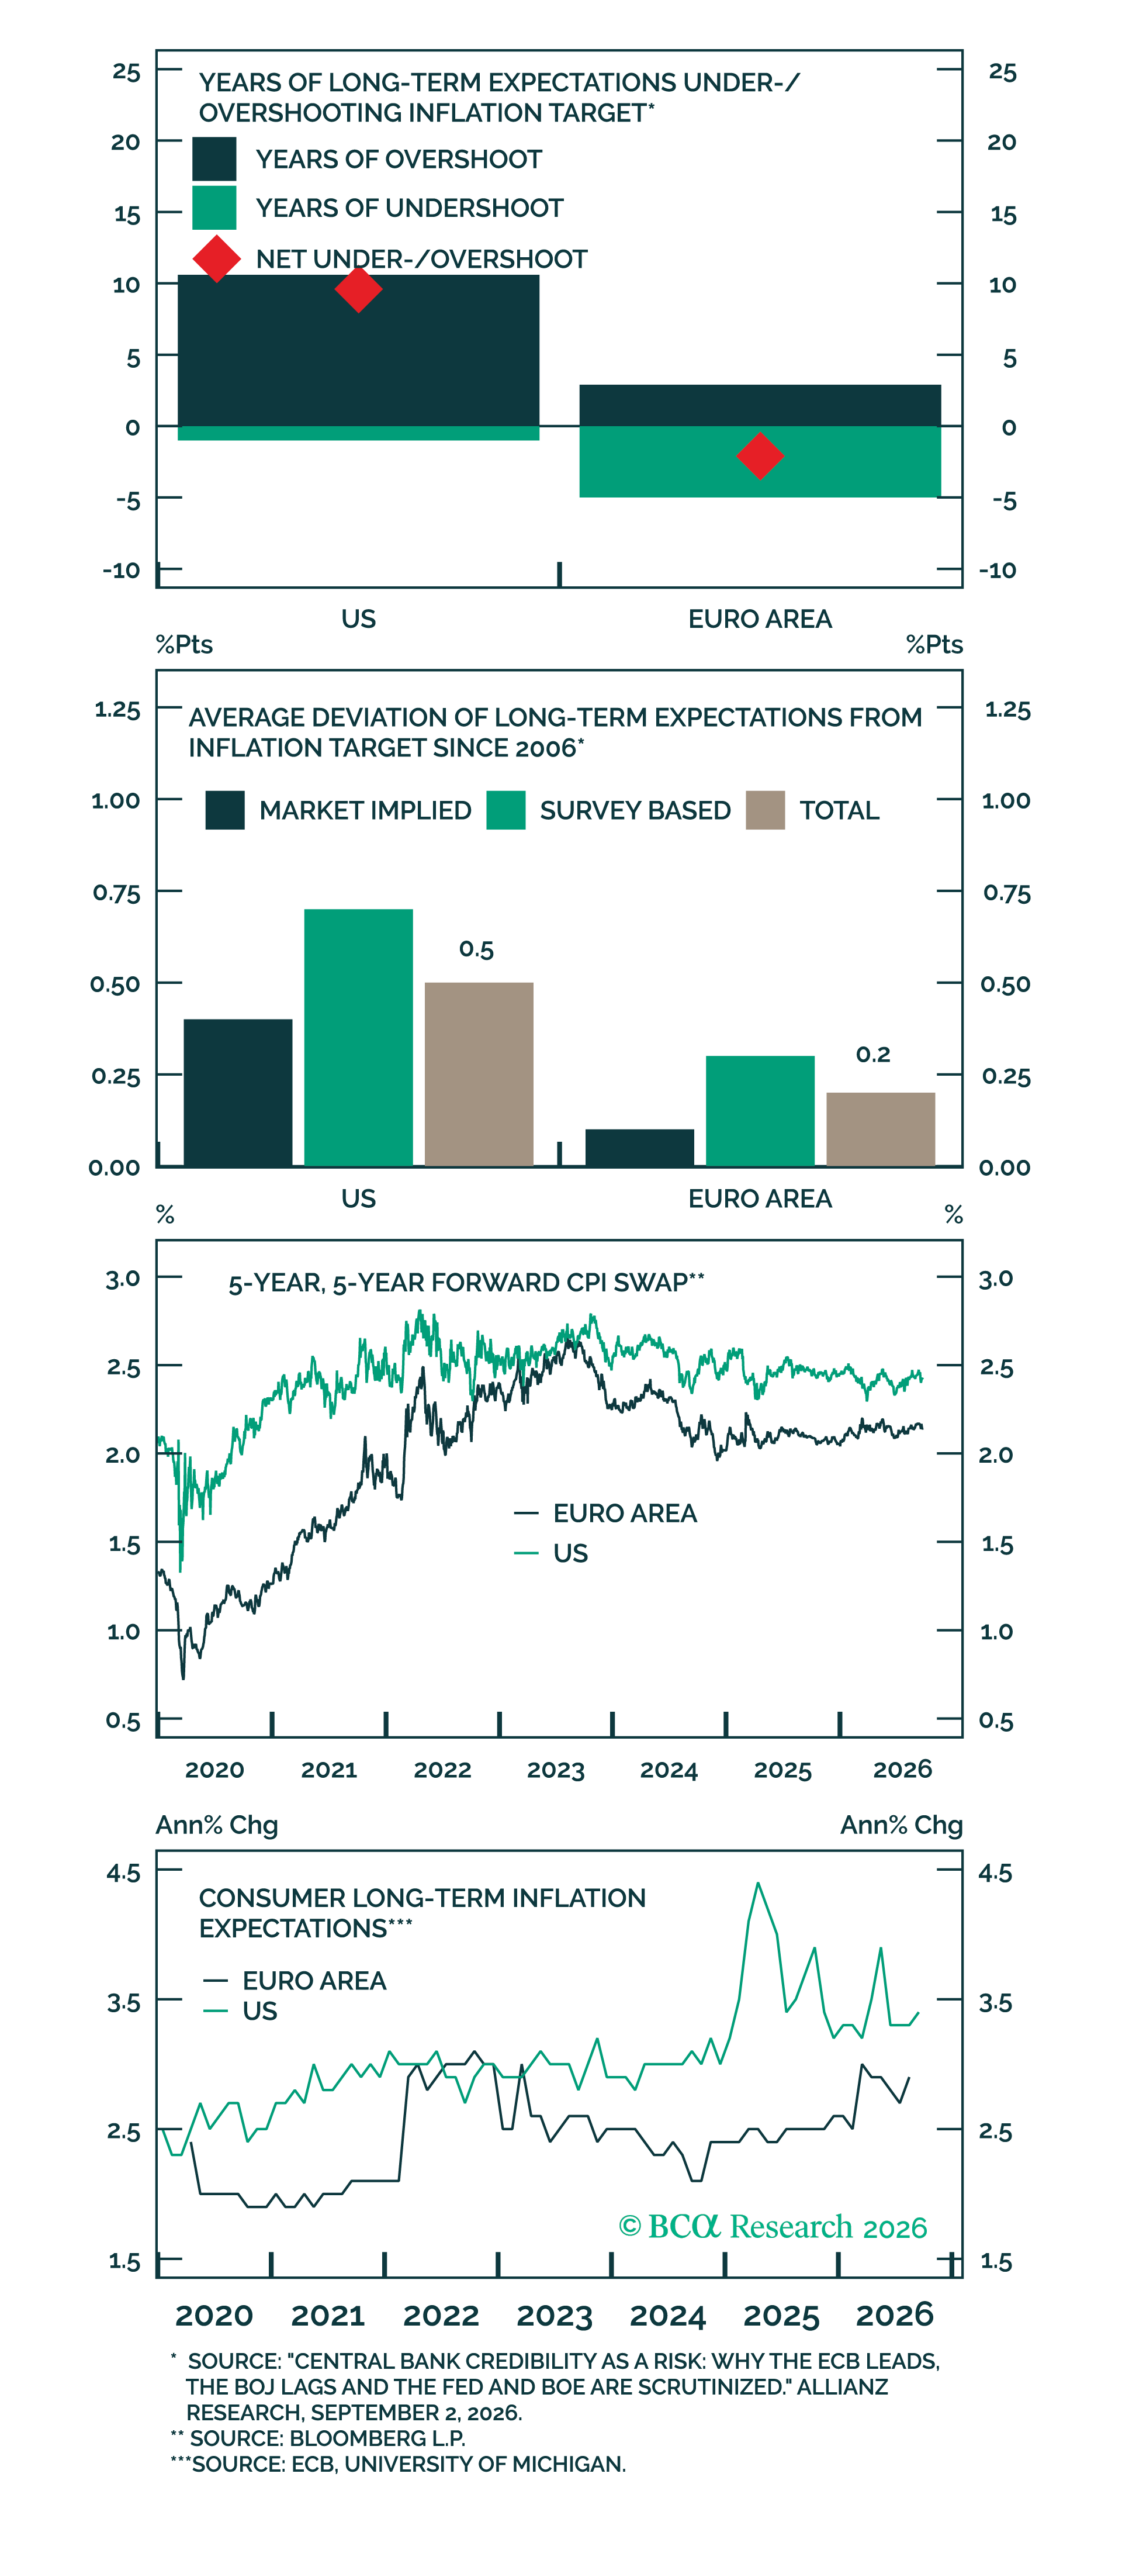
Figure 2 – Euro area inflation expectations are better anchored.
Euro area long-term inflation expectations have strayed from 2% by an average of 20 basis points (“bps”) over twenty years, against 50 bps in the US – see Figure 2. A bank with a record like this should need to do less, especially as its rate already sits at the upper end of neutral estimates (the policy rate that neither stimulates nor restrains the economy’s growth) and pushing further would risk the growth that has so far walked a tight rope.
Britain is perhaps a different story. The BoE held at 3.75% by six votes to three, and would probably have already started cutting without the energy shock, since wage growth has normalised and labour market slack has opened. With inflation expectations elevated, a hike on 5 November (85% priced) to protect credibility is plausible, but the roughly 100 basis points priced over the year is not, as mortgage rates have already tightened conditions.
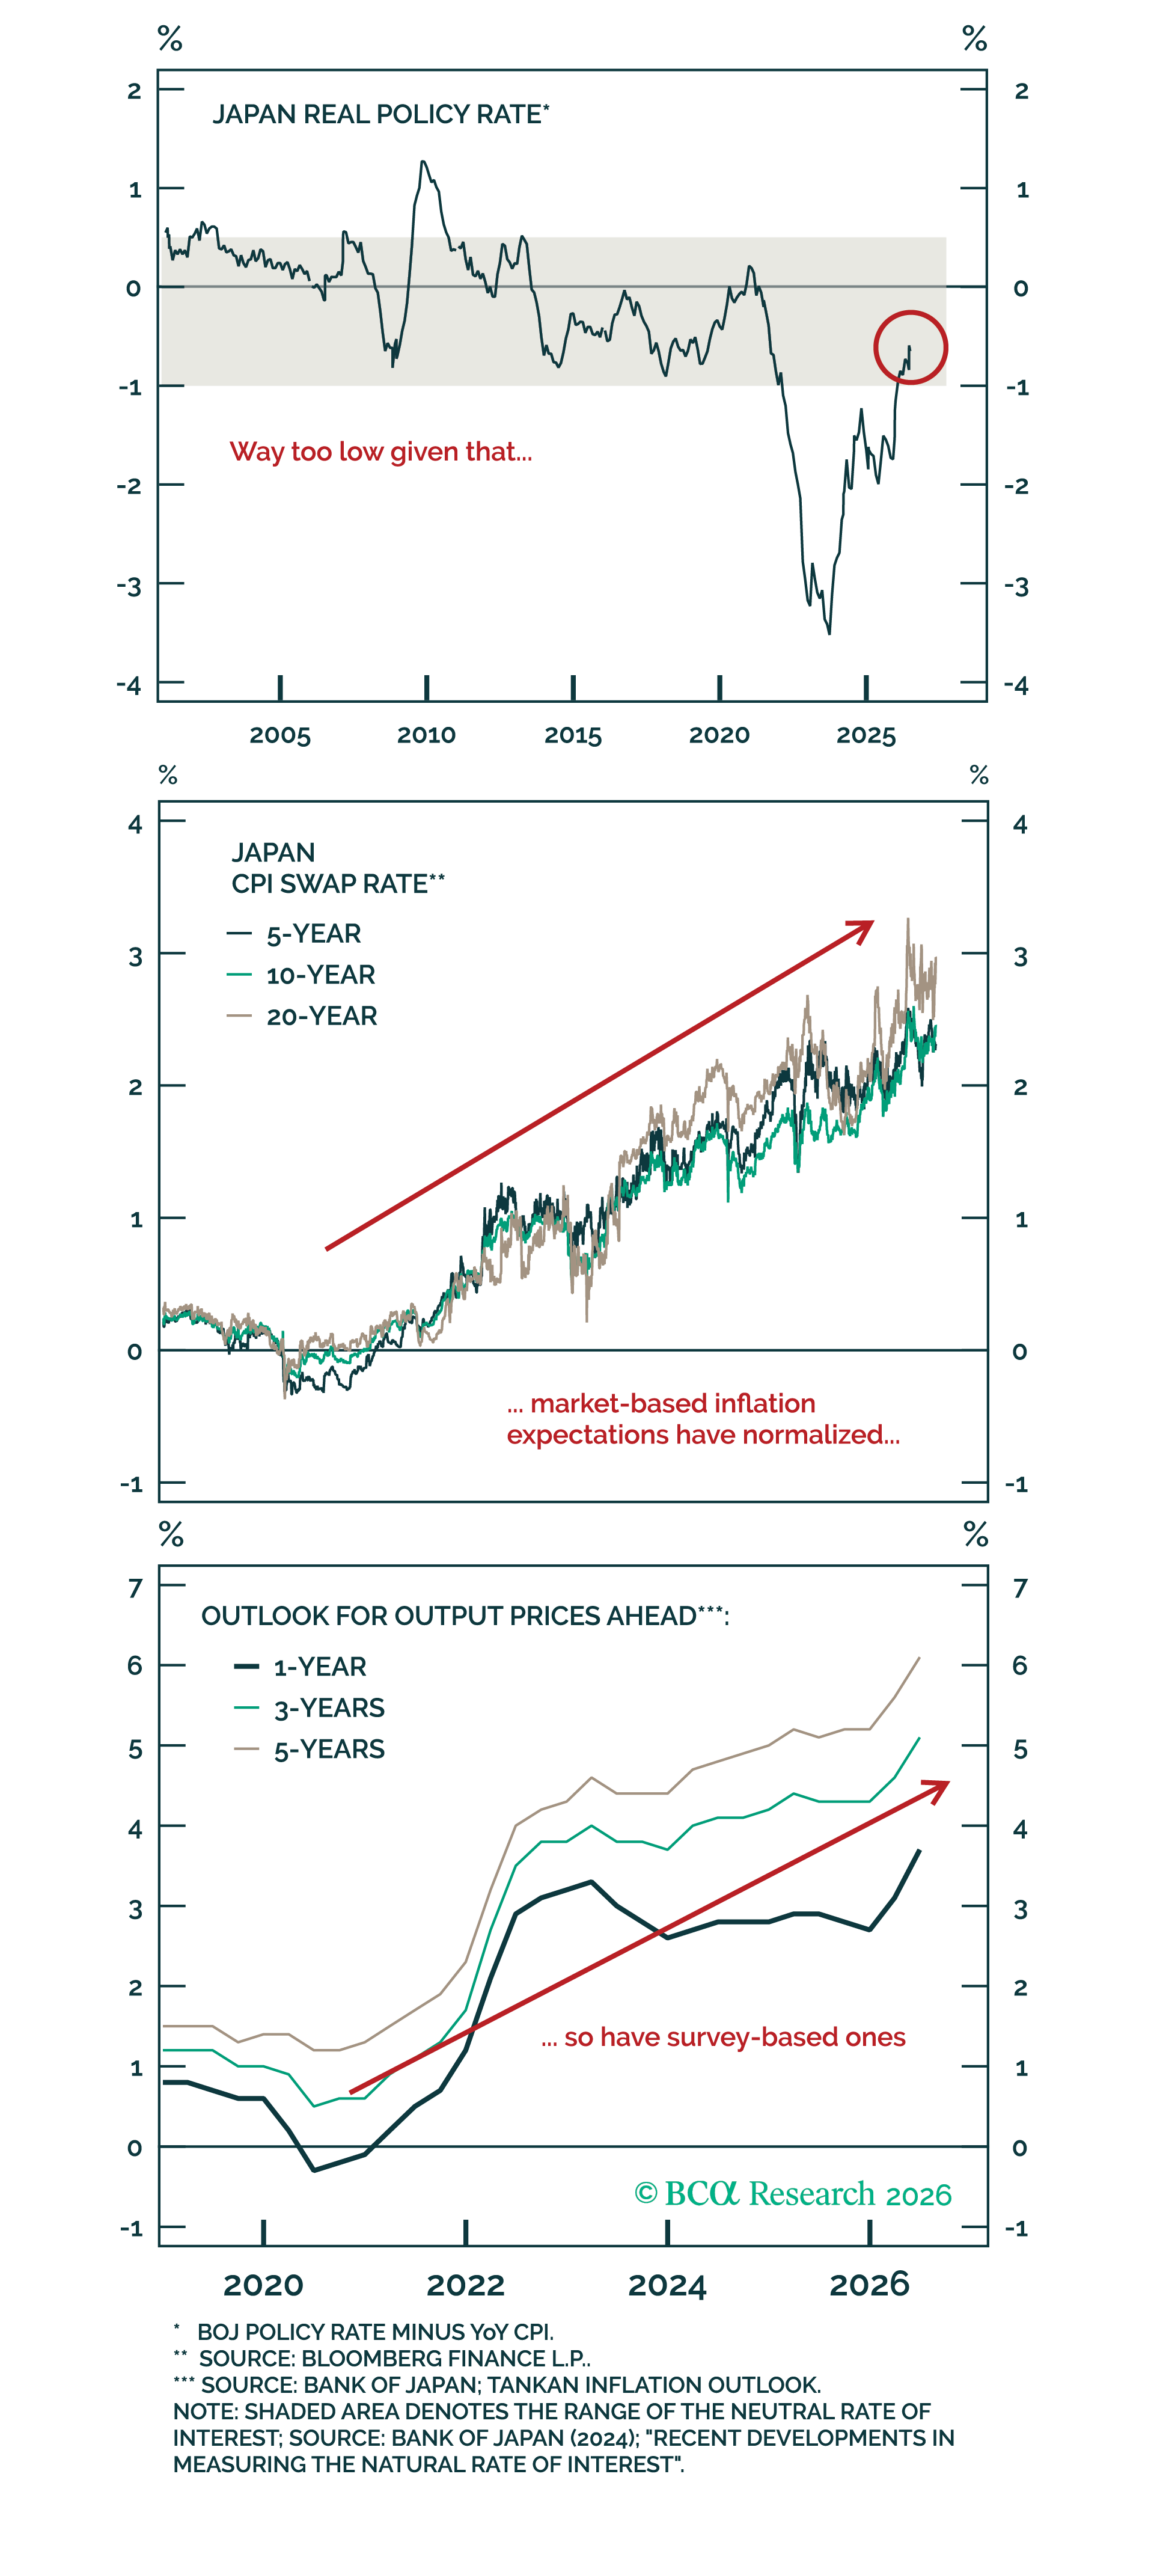
Figure 3 – Japan’s real policy rate remains too low.
Japan is the exception to the market’s pricing of policy, running the other way. The BoJ raised its rate to 1.25% on reasonable logic: underlying inflation is near 2%, wages are growing above 4% and inflation expectations are rising, leaving the policy rate negative in real terms, meaning below inflation – see Figure 3. Here, the eventual policy could end up 100 bps or more above current market pricing.
The Fed hike, taken apart
The Fed’s position is more of a mixed bag. In September, it lifted the funds rate range to 3.75–4.00%, ending an easing cycle of 175 basis points that stopped above the committee’s estimate of the neutral rate.

Figure 4 – Shelter inflation is below its 2019 average.
That pricing was well above the Fed’s own projections, and the latest data have since softened the inflation story: August headline PCE was revised to 3.4%, core to 3.0%, and six-month annualised inflation to just 2.74%. A big reason is a change in calculation methodology, which adjusts how price increases for services such as portfolio management, legal services and software are incorporated into the inflation read. Shelter (which constitutes 35% of consumer prices) has also been a significant tailwind, spending the last eleven months below its 2019 average of 3.4% – see Figure 4.
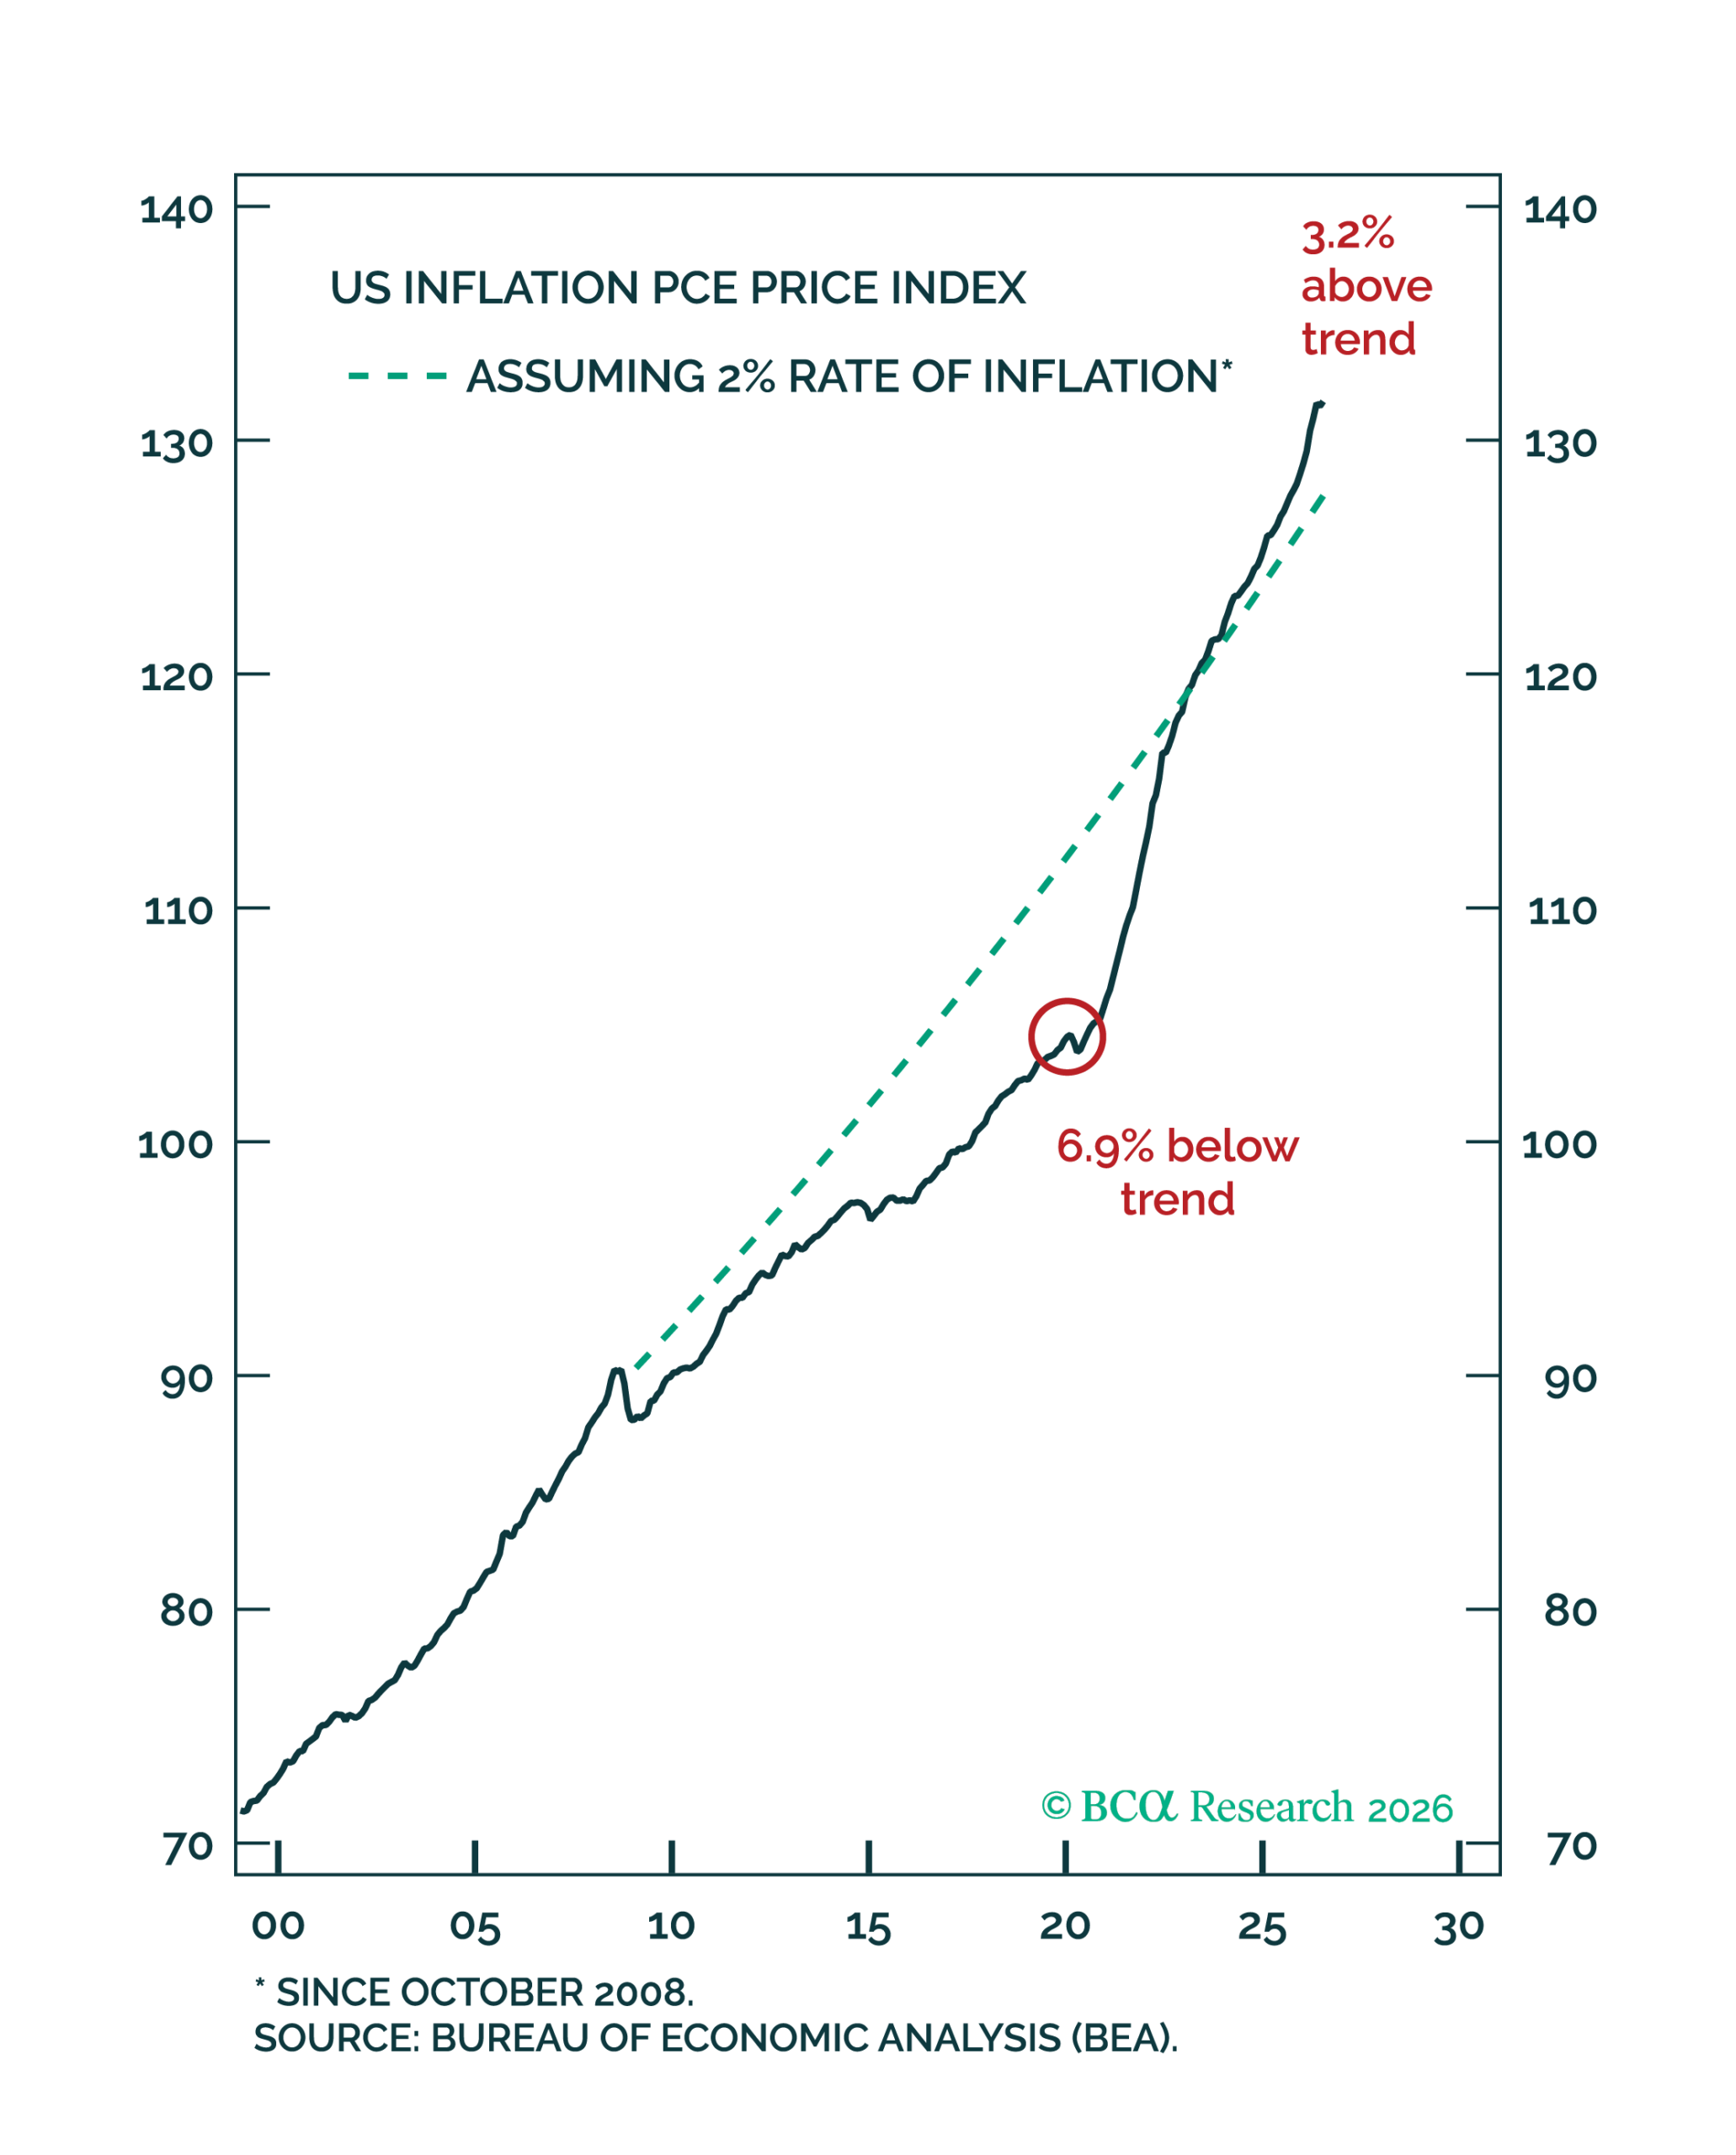
Figure 5 – The US price level is now above its 2% trend path.
However, the macro picture in the US is not entirely benign. Core PCE inflation (which is the Fed’s preferred monitor of inflation) still sits above the 2.0% target, and this is not a new phenomenon. Inflation has been above target for more than five years, which suggests it is slowly becoming a structural gap. At the start of this decade, the headline PCE price index was 6.9% lower than it would have been if inflation had sat at the 2.0% target since 2008, reflecting the persistently low inflation of the 2010s. Inflation over the last five years has wiped out all of that gap, and the actual price index now sits 3.2% above its implied trend level – see Figure 5.
Wage measures have also firmed, and the AI investment boom and the large fiscal deficit may keep the neutral rate and long-term yields elevated. AI spending raises demand for capital while the wealth it creates reduces saving, and the deficit is also adding to the supply of Treasuries. But inevitably, these are all arguments for caution, not necessarily for more near-term tightening. With the New York Fed president signalling patience, an October pause now looks increasingly plausible.
Bonds flinched, equities did not

Figure 6 – US shares look expensive at 2019 margins.
Of the forces keeping yields high, the AI boom is the one that also has supported equities, with US equities having all but faded the move in bonds. Right now, the S&P 500 trades at a 19x price-to-forward earnings, in line with its ten-year average, but expected profit margins are 16.7%. This is 4.8% above the 2019 margin. Viewing the market under this normalised lens (i.e. once corporate margins mature to reflect the full cost of the AI buildout recognised via depreciation) of 2019 margins, the multiple would be 26.7x – see Figure 6. While using 2019 margins as a normalised benchmark is not necessarily a perfect exercise, it is not out of the question that current corporate margins are well above sustainable levels.
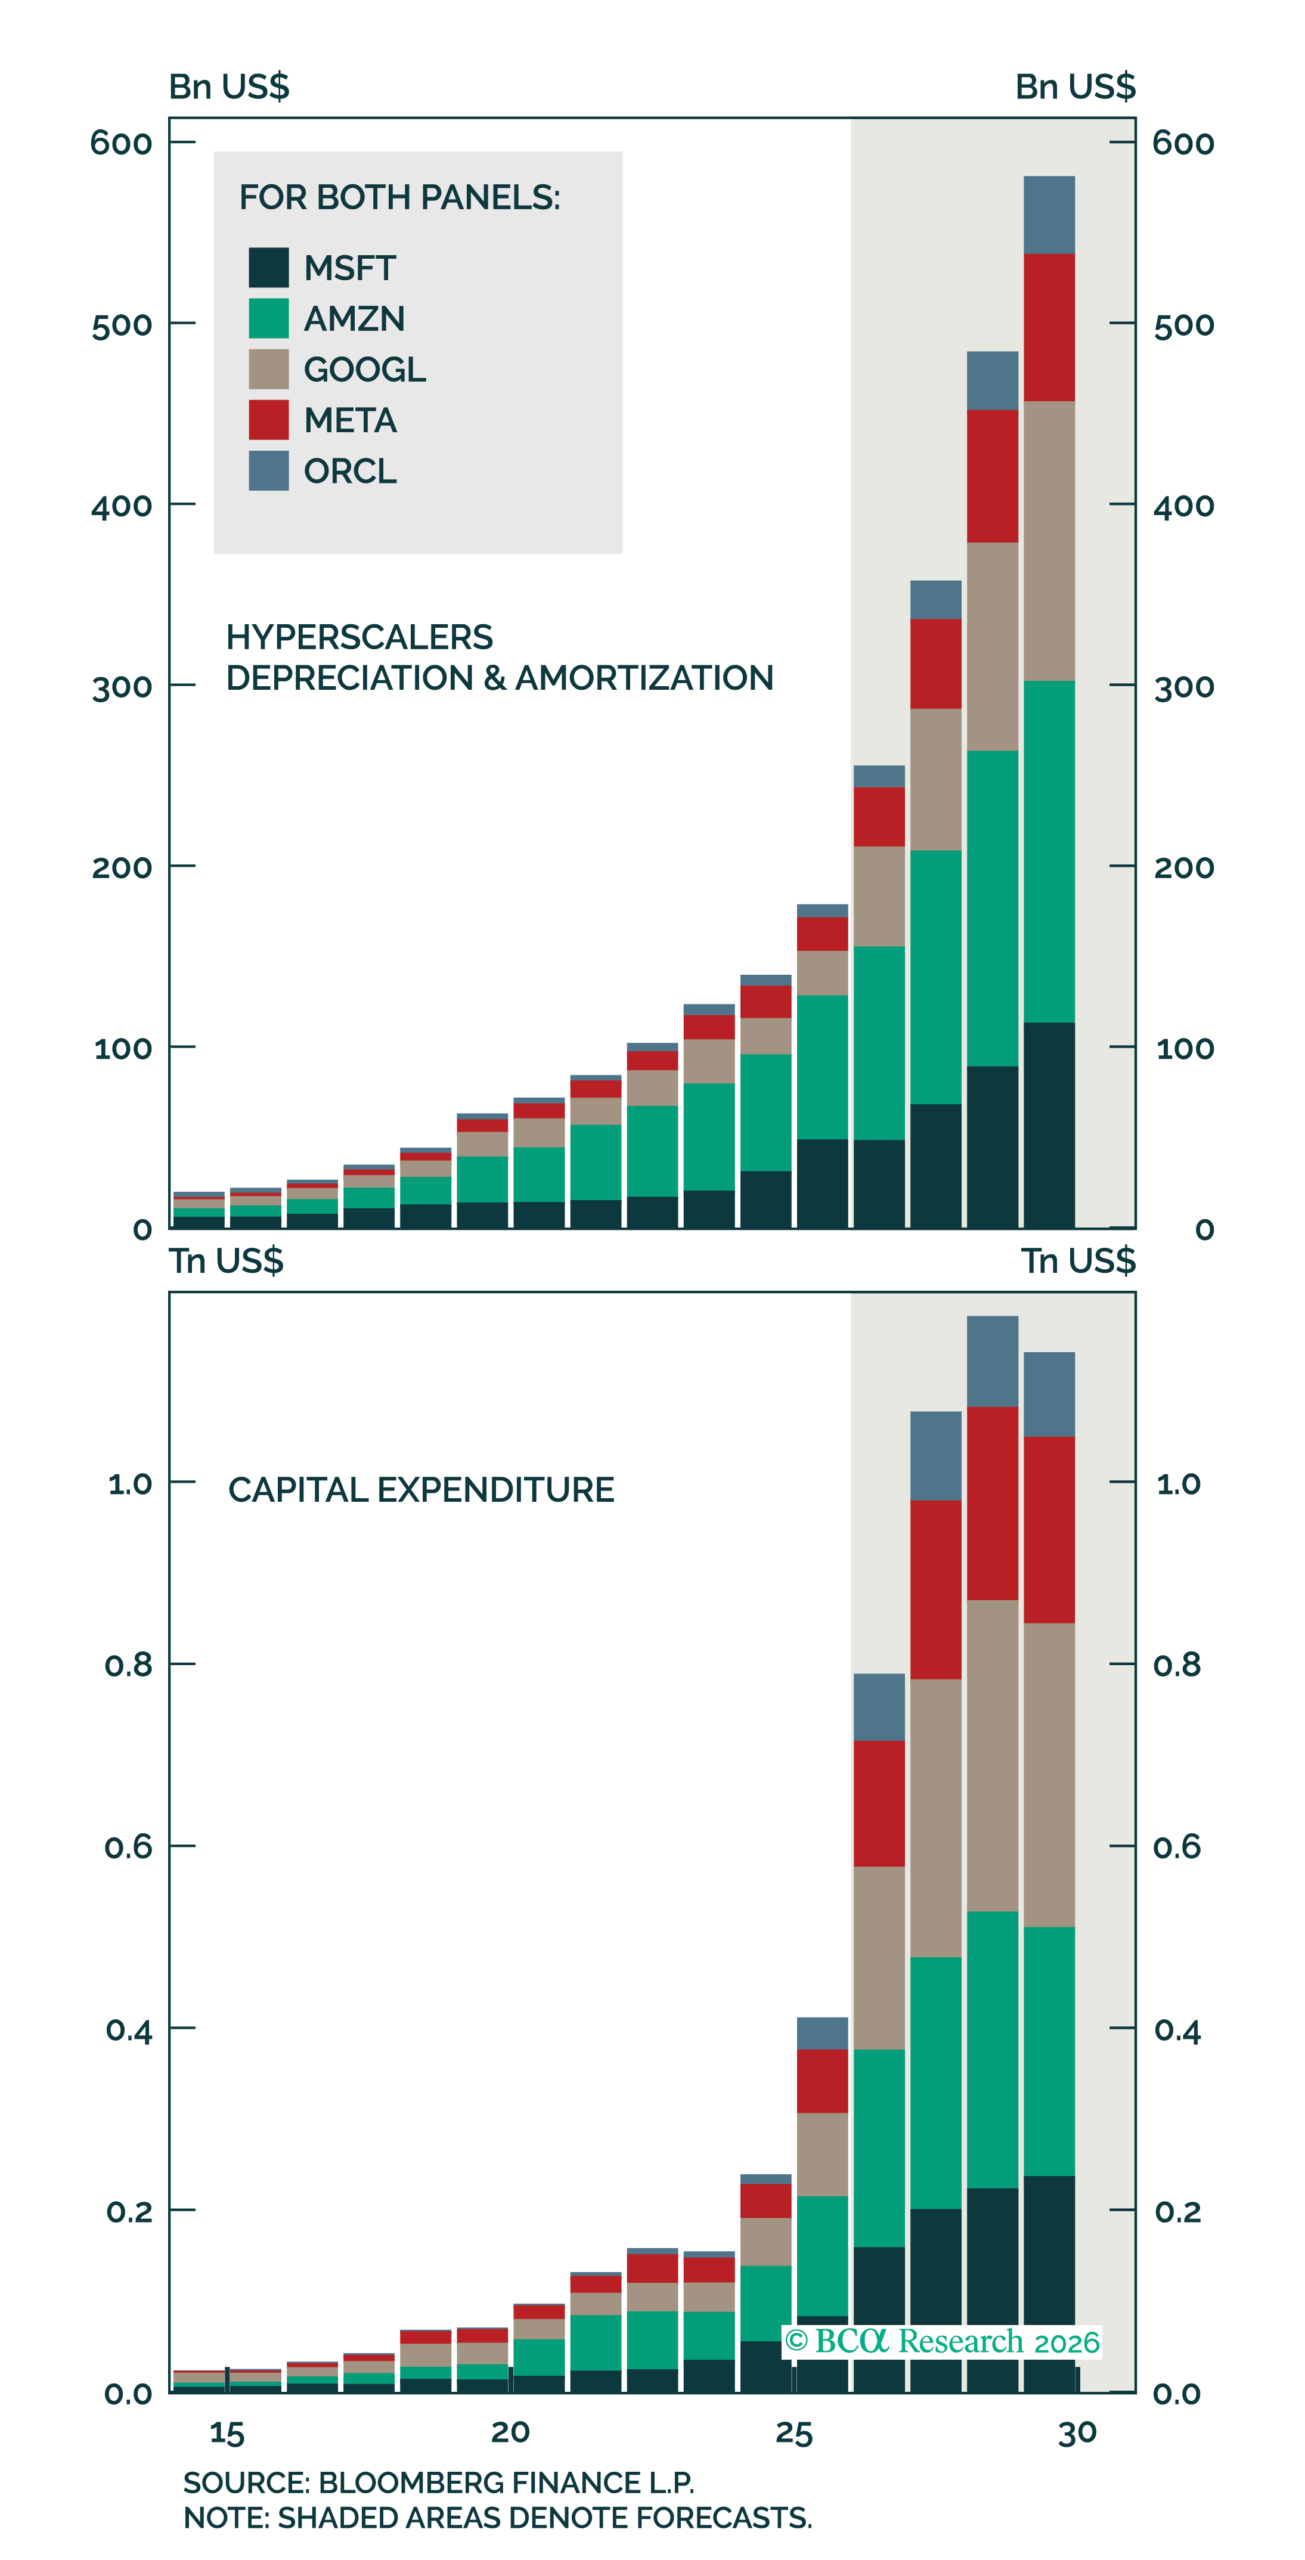
Figure 7 – Cloud depreciation is set to more than double.
As it stands, falling labour costs (real unit labour costs fell 3.3% year-on-year) and AI spending are propping margins up. The accounting asymmetry we covered in a previous synopsis continues, with chip makers booking profit on the sale while buyers spread the cost over several years, but the impending bill at the end of this fancy dinner still lingers. Depreciation at the large cloud companies is expected to rise from $255 billion this year to $581 billion by 2029, against operating profits of $569 billion in 2026 – see Figure 7.
The larger question is what the spending must earn. At $1.4 trillion of annual capital expenditure, the five largest cloud companies would need about $7.4 trillion of revenue for a 15% ROIC return, assuming a 30% margin before depreciation. Taking median estimates from a range of analysts, the market is loosely expecting roughly $5 trillion of revenue required, for a 20% expected ROIC. Including
Token prices (the unit in which AI usage is billed) have fallen for three months, and cheaper units lift revenue only if demand grows faster than prices fall. Happening at the same time as this, coincidently, is the recent “go slow” stance communicated by AI developers that has been framed as safety. However, this could also reflect a colluded effort to bring down chip and memory costs for all of them. Given the implicit arms race in AI between the US and China, it is likely the American government does not want the industry to fail, and would swoop in to save any stumbles, at least while they can in the short-run.
Against that, demand shows no sign of turning for now. Rental rates for AI chips are firm, memory prices are rising and adoption keeps trending upward, which is why a base case for share prices could simply be meagre share growth this year, with a fall only gaining legs by 2027. In this case, US equities would hypothetically retain its high margins via pricing-power, but rising depreciation or a wage pick-up would then erode this.
Investment takeaway
The central bank picture points away from more tightening. Outside Japan, the hikes priced into markets look larger than economies need, most notably in Europe, where the ECB’s credibility lets it do less. In the US, the revised inflation data make an October pause more likely. However, a pause is not the same as lower yields. With core inflation above target for five years, a firmer labour market, an AI boom that lifts the neutral rate and a large deficit, long-dated yields are being effectively set by forces the Fed cannot control.
For equities, the difficulty is that multiples are only looking ordinary because of extraordinary margins. The data supports staying invested, provided you are not paying for a company’s latest margin growth alone, given its likely link to the AI cycle. This would mean equal weight in US and euro area equities on the broad scope, and a preference for defensive over cyclical sectors. A large bet on either sector at this time could hold uncompensated risk, given the signs that we are entering a late stage in the economic cycle.
If you are interested in finding out more about how cognisance of the macroeconomic backdrop impacts our investment decision making process, connect with Integrity Asset Management and let us help you navigate your investing journey.
For more information on this synopsis or to discuss solutions provided by Integrity Asset Management, please contact us at:
Tel: (021) 671 2112
Cell: 072 513 2684 / 084 601 1025
E-mail: nic@integrityam.co.za / herman@integrityam.co.za
Source: Bloomberg, 30 September 2026