
The tide comes in anyway
The United States Treasury announced in August that it would increase the size of its ongoing repurchases of long-maturity securities, and the reaction was a near-universal disdain. The 30-year benchmark has been pushed to its highest level since 2007 – see Figure 1, and the Treasury department would ideally like to turn that around. Whether they can achieve this is a separate question, and doing so would be no easy task. As it stands, there are three main options, each facing its own obstacle:
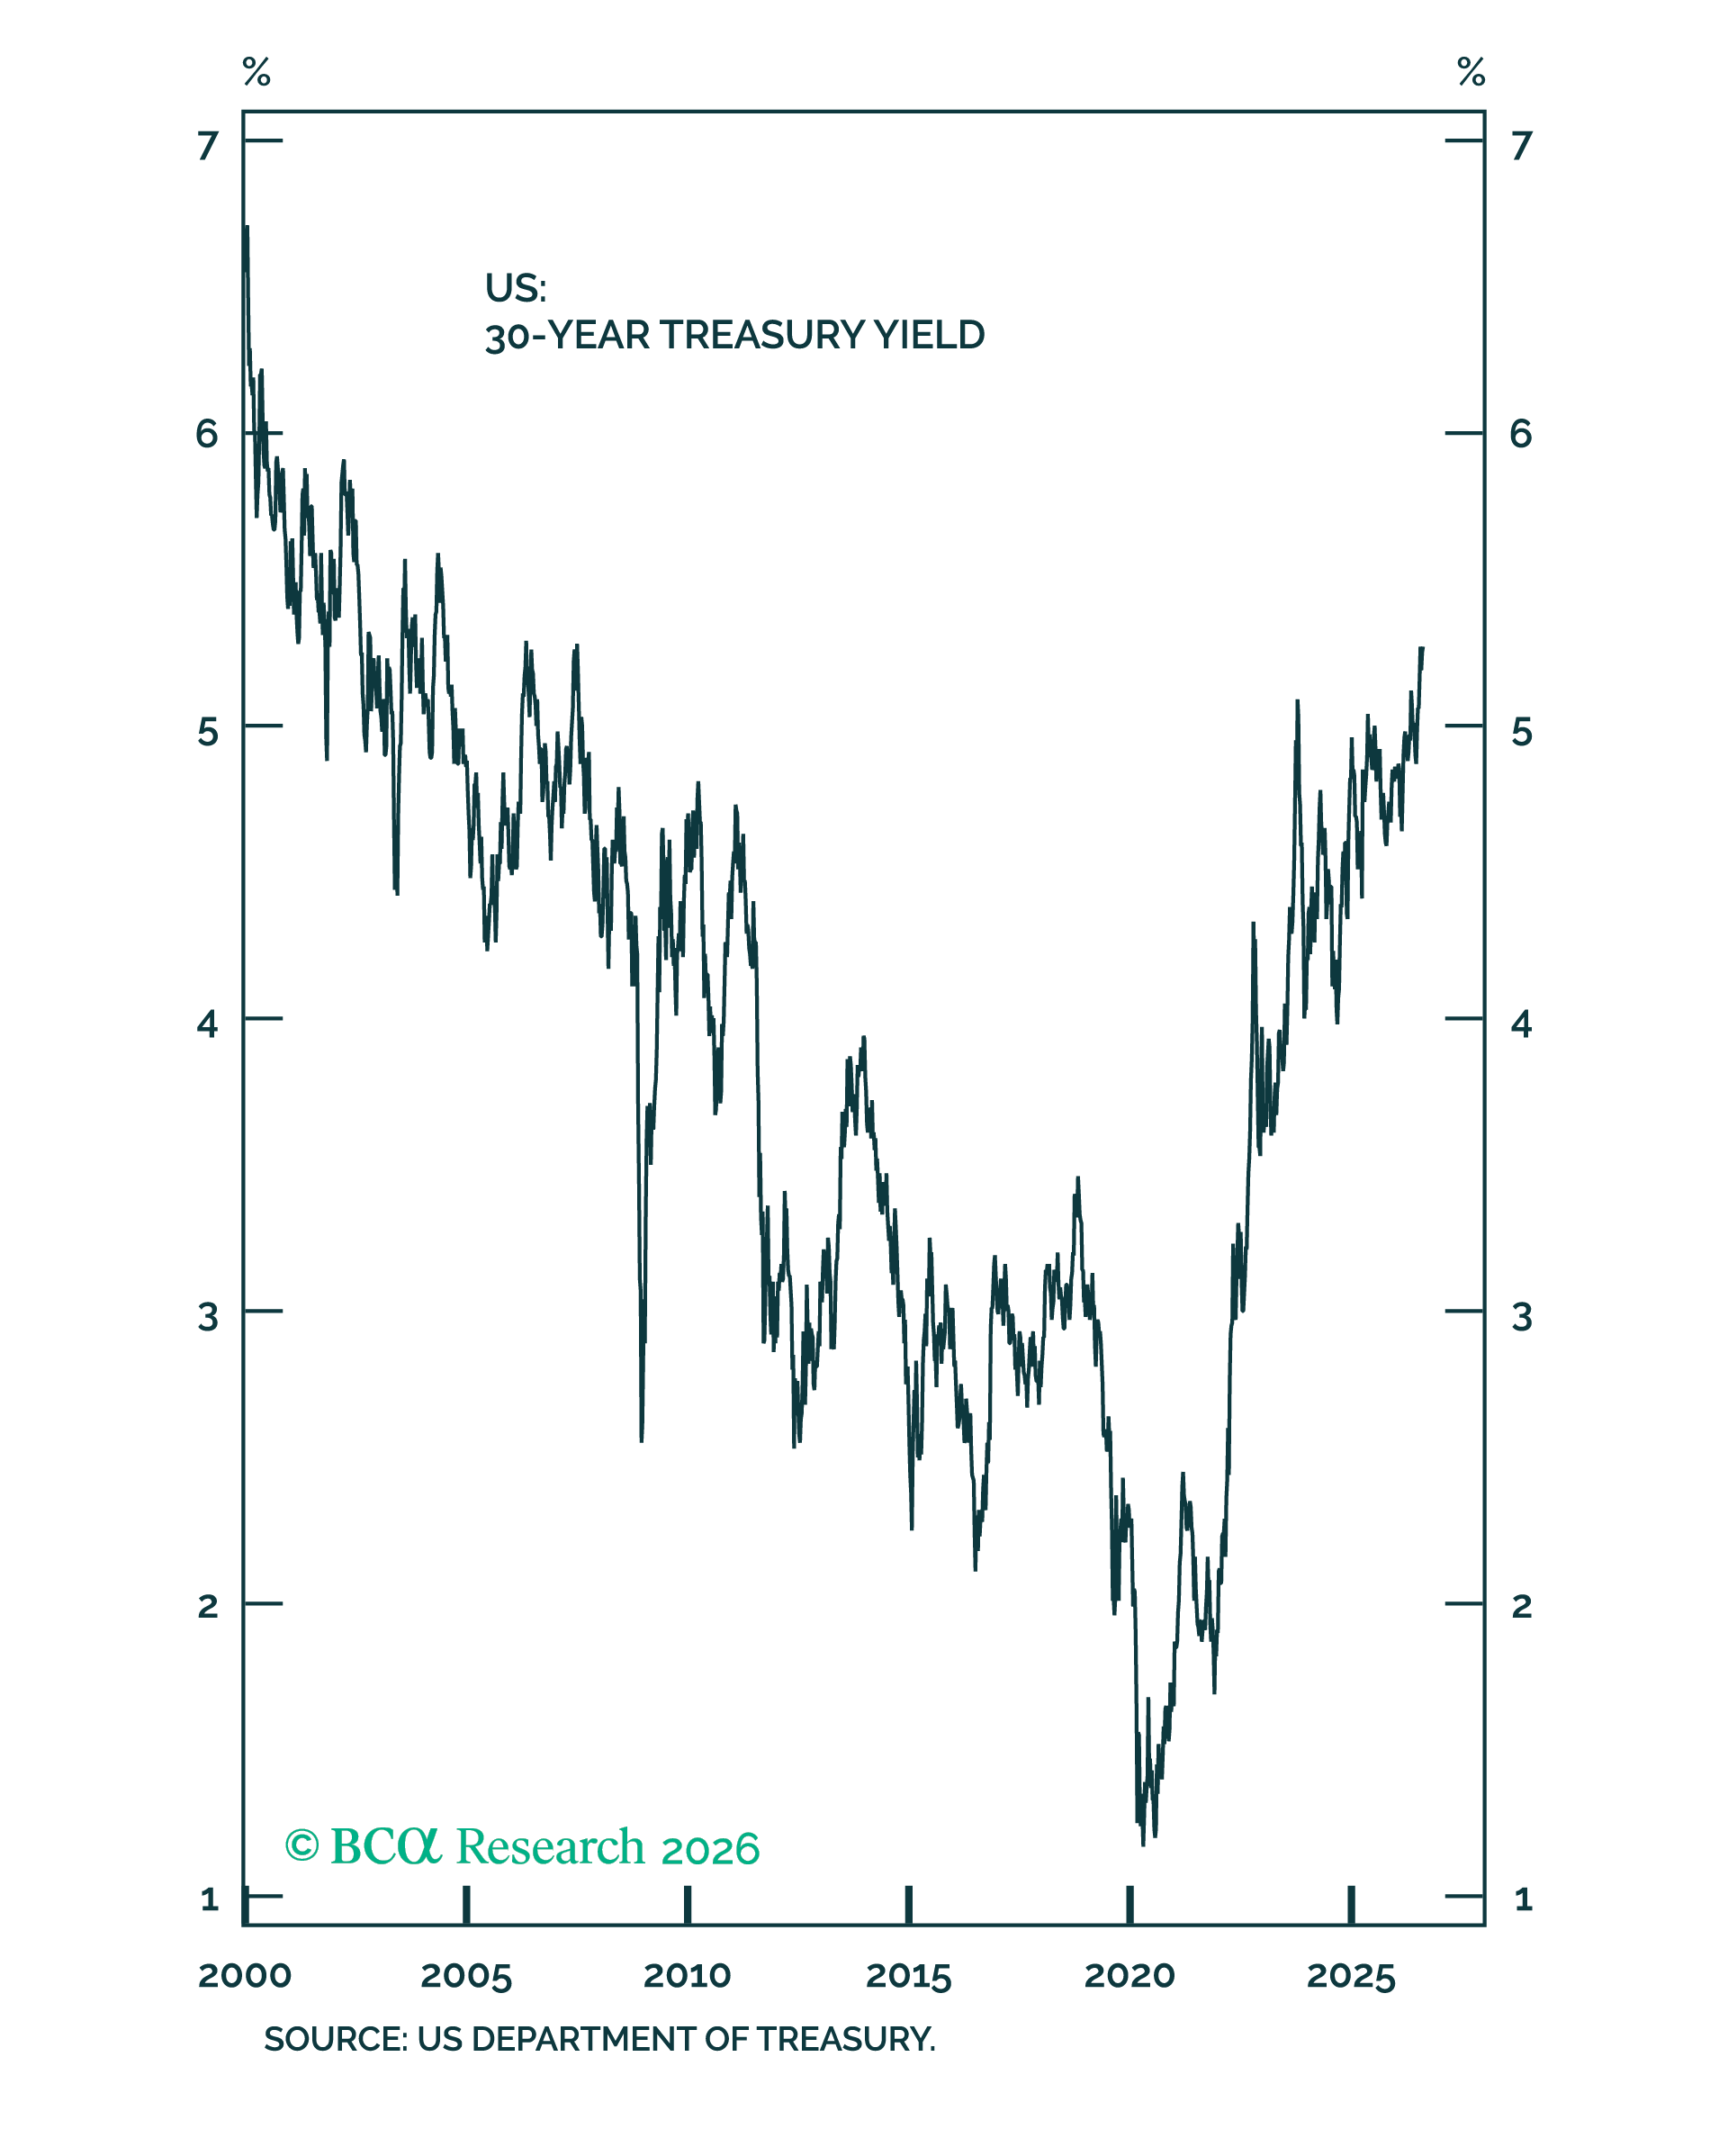
Figure 1 – The long bond yield has made a post-crisis high
Option 1: A buyback via cash reserves
A buyback works by the Treasury purchasing its own outstanding bonds in the open market, retiring supply, and thereby pushing prices up and yields down. The money to do that has to come from somewhere, and the readiest source is the department’s own cash reserve held at the Federal Reserve, the Treasury General Account (“TGA”). That balance currently sits at close to $1 trillion. Against $5.5 trillion of bonds held by the public, deploying the entire account would retire roughly 18% of them, which would certainly move yields. But the Treasury has to logically keep some cash within the TGA to smooth its own payment mismatches, and survive any debt ceiling standoffs. Given the account’s history, the preference has been a floor somewhere between $500 and $750 billion – see Figure 2. That leaves $200 to $450 billion of realistic firepower, or enough to retire 4% to 9% of outstanding bonds. Realistically, bond investors who look past the announcement are not going to be convinced to bid yields much lower on purely the TGA channel alone.
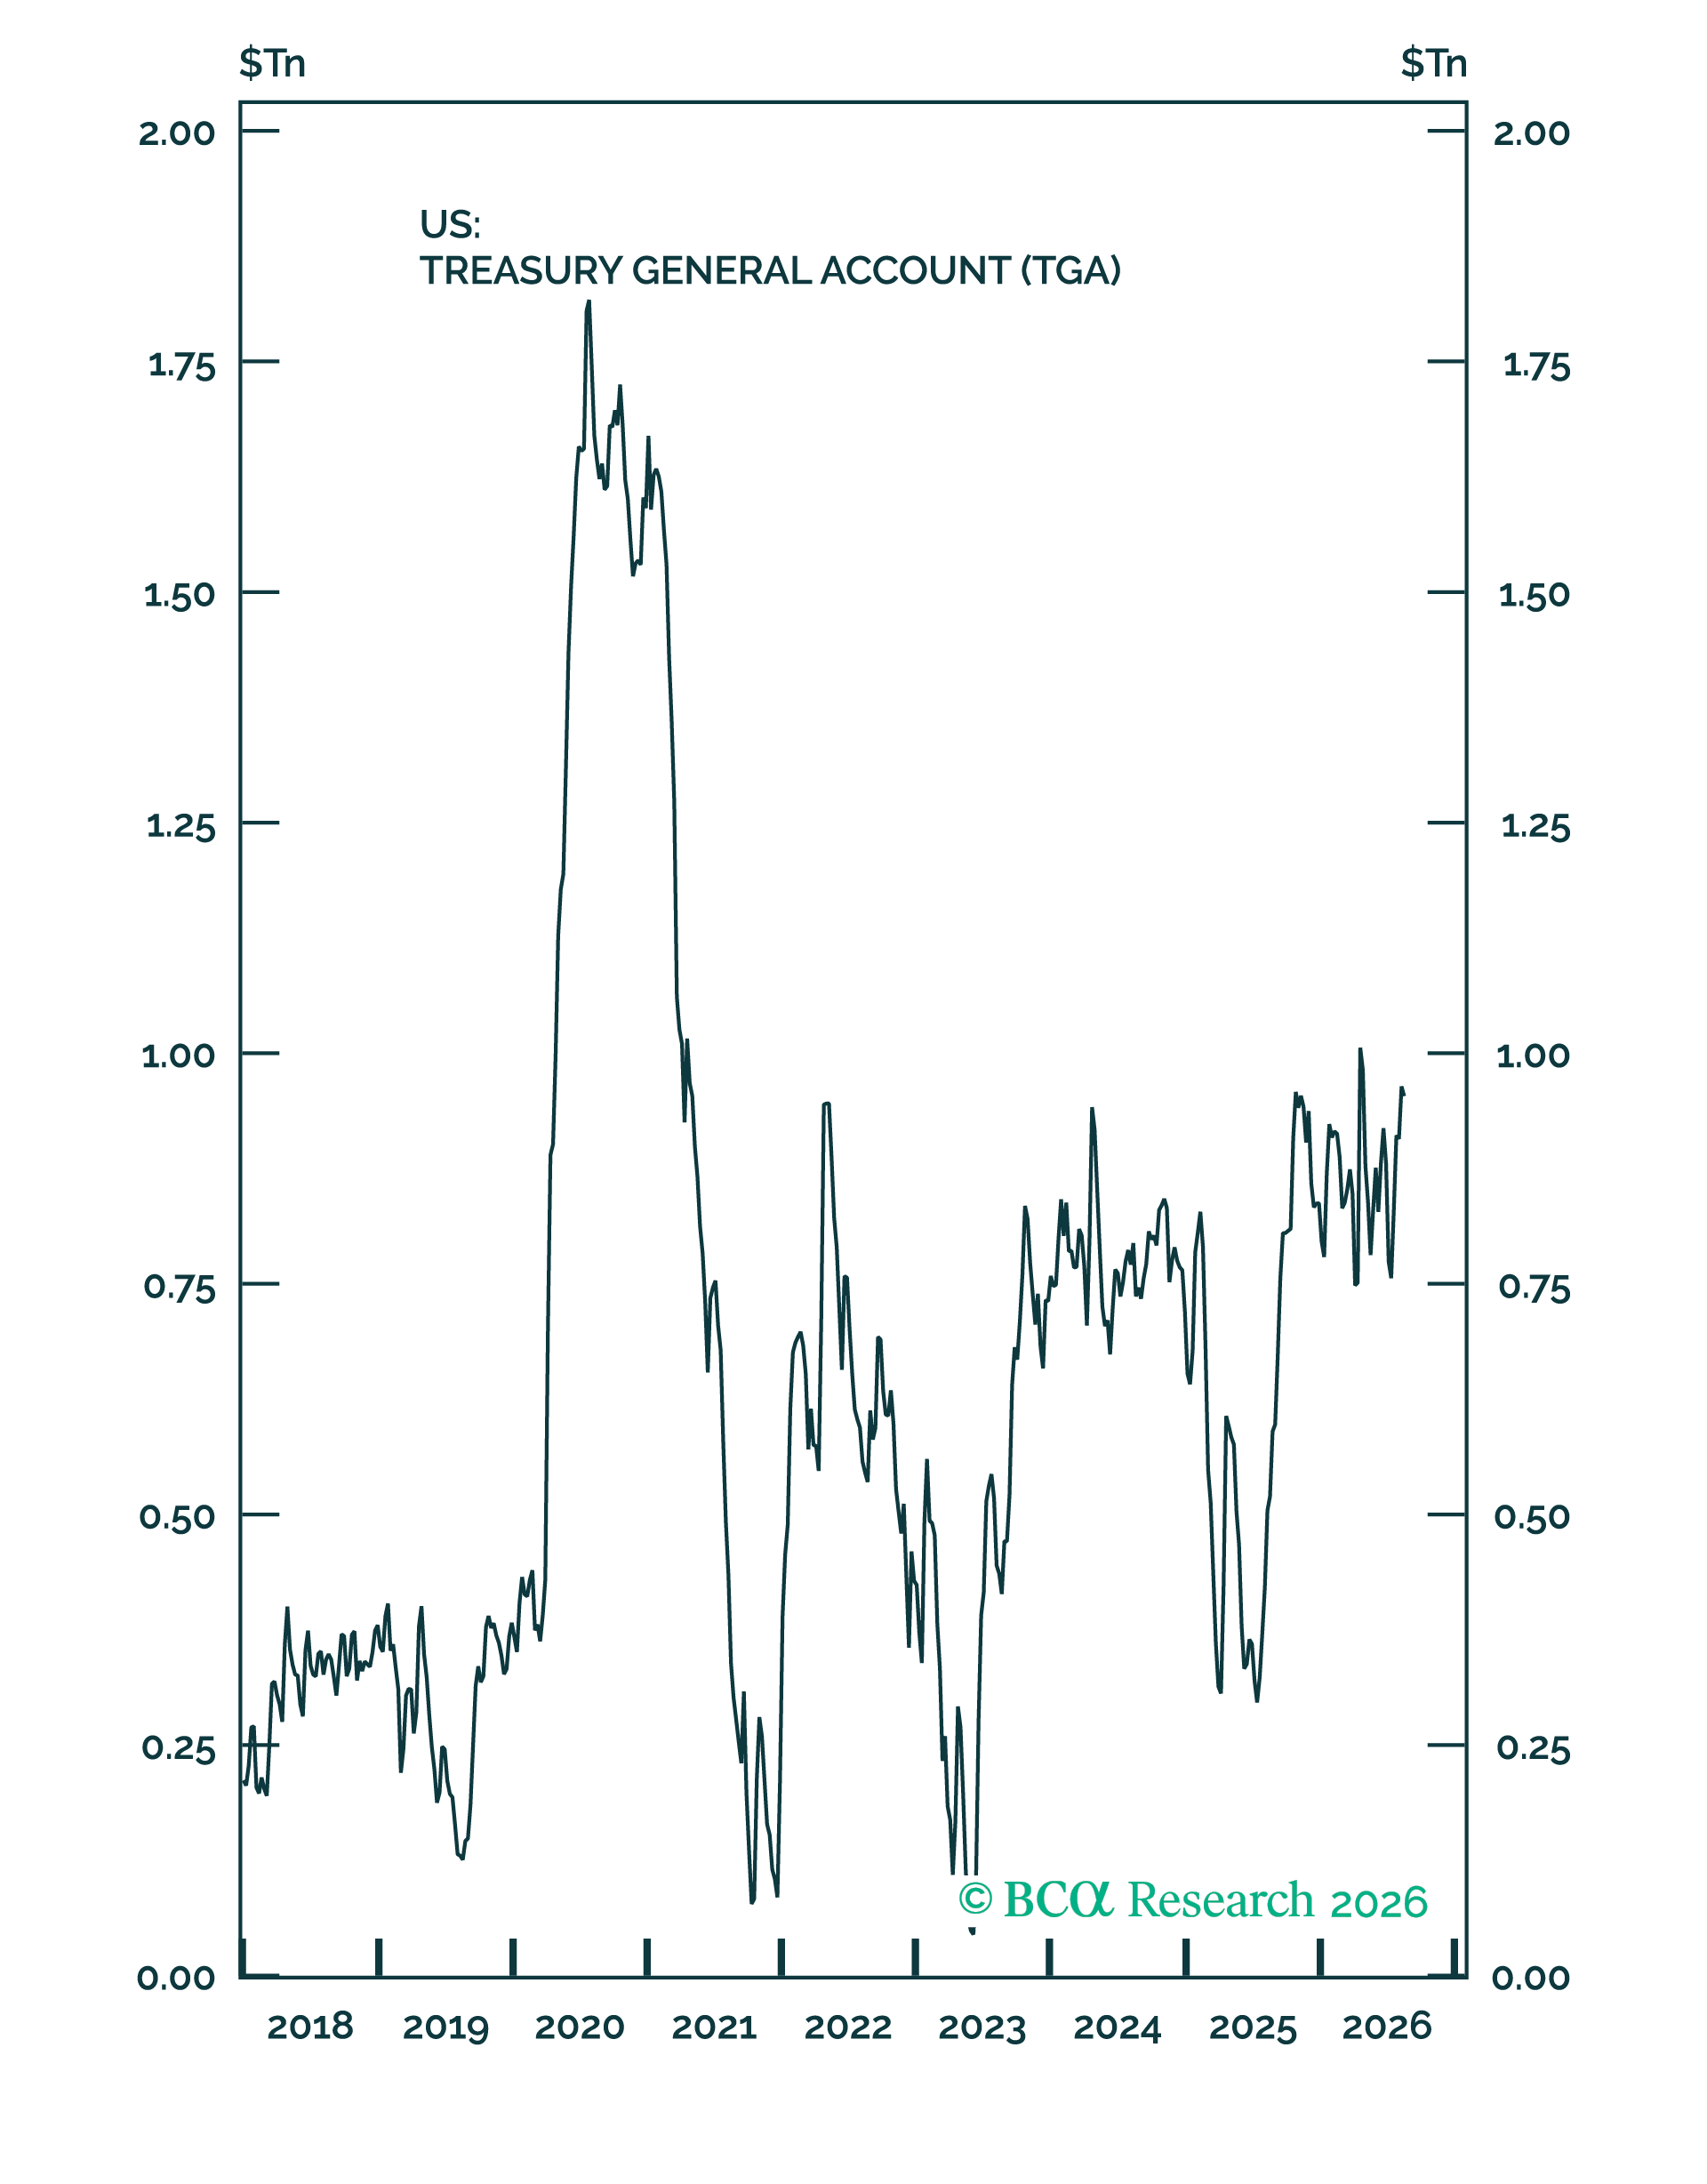
Figure 2 – Not much of a war chest
Option 2: A buyback via bill issuance
The alternative is to fund the purchases by issuing more Treasury bills, leaving total borrowing unchanged and simply shifting its composition towards the front end. This is the same manoeuvre as the Operation Twist of 2011-12. The binding constraint for this to work the way the US Treasury would want is reliant on the willingness of the market to absorb these extra bills.
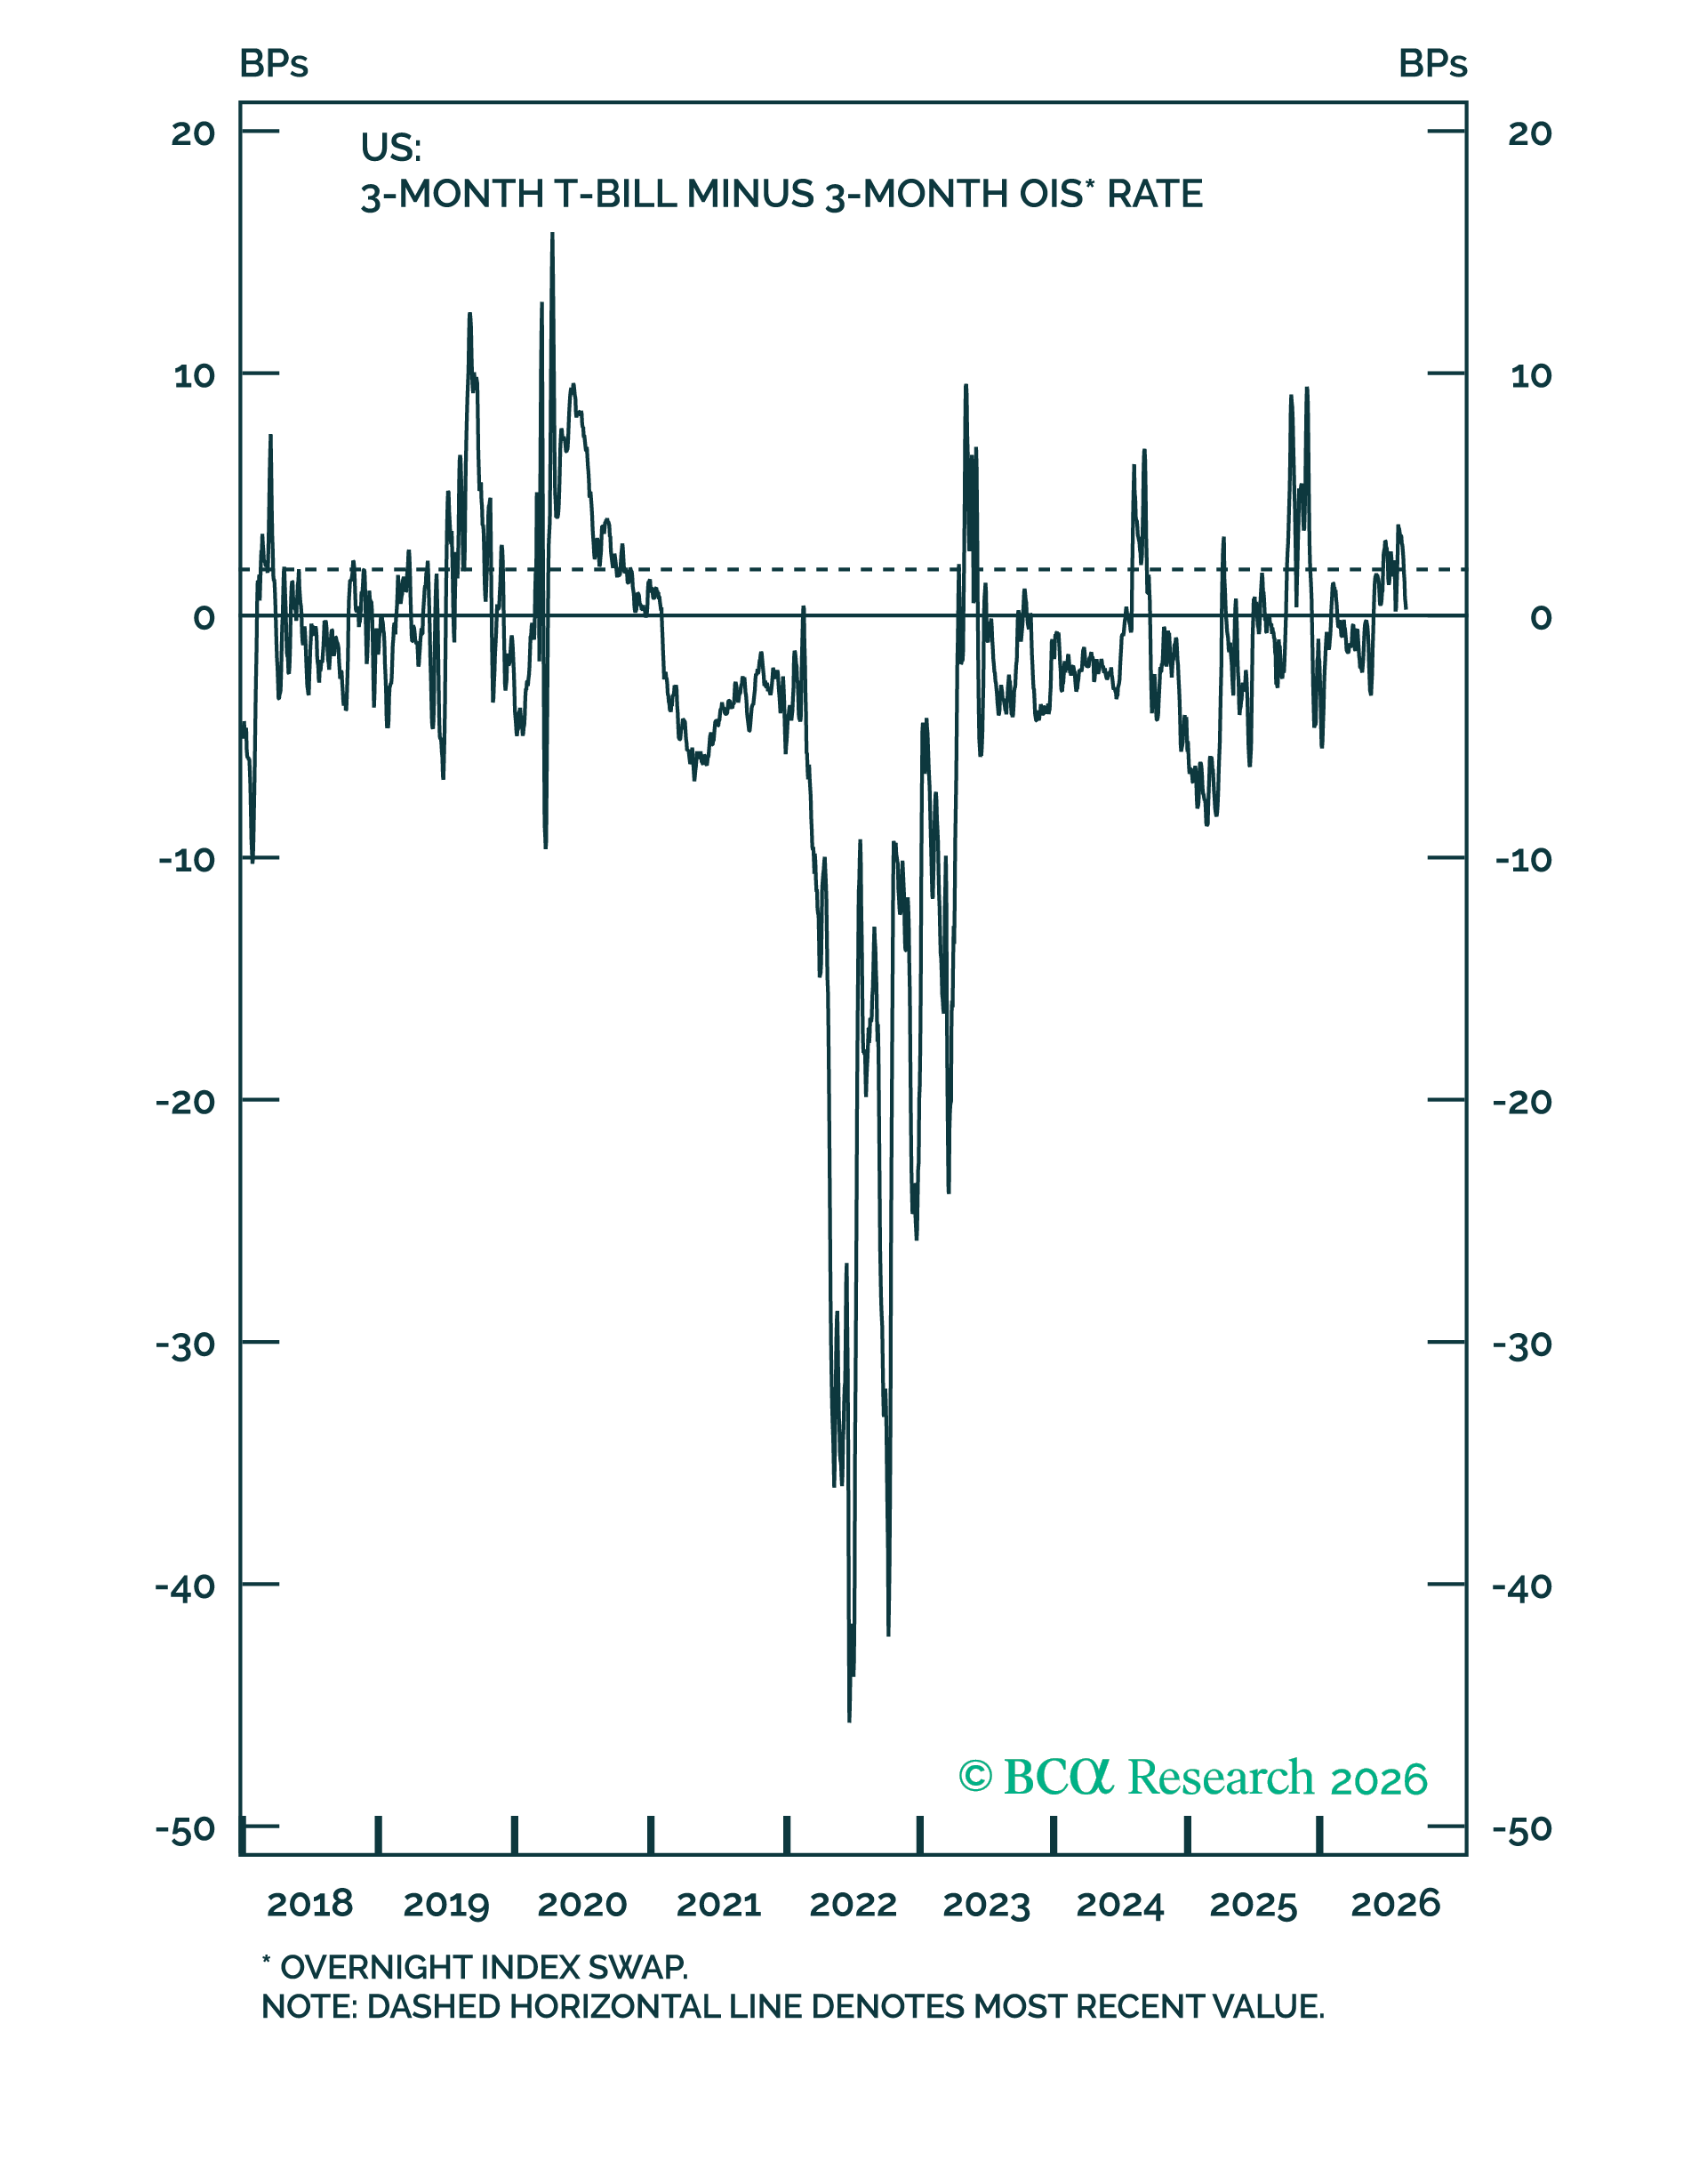
Figure 3 – The bill-swap spread is already a little stretched
The first indication of willingness shows up in the spread between the three-month bill rate and the three-month overnight index swap rate. The swap rate represents what the market expects the average overnight rate to be across that window, so a bill yielding meaningfully more than the swap is a bill that had to be discounted to find a buyer, while the two should normally trade close together. That spread is already somewhat stretched on this basis – see Figure 3. Pushing it wider by issuing more bills would begin to raise questions on banks’ access to short-term repo funding, at which point the Treasury would be almost forced to reduce bill issuance rather than expand it.
Option 3: The Federal Reserve
The one institution with unlimited capacity to buy bonds is the Federal Reserve, but the new Warsh-led committee has been explicit about wanting a smaller balance sheet, not a larger one. With inflation still above target and no sign of disorderly market functioning, there is no case for open-ended purchases. Without the Fed, the Treasury can say whatever it likes to the bond market, and bond vigilantes can decline to listen.
What the long end is telling us
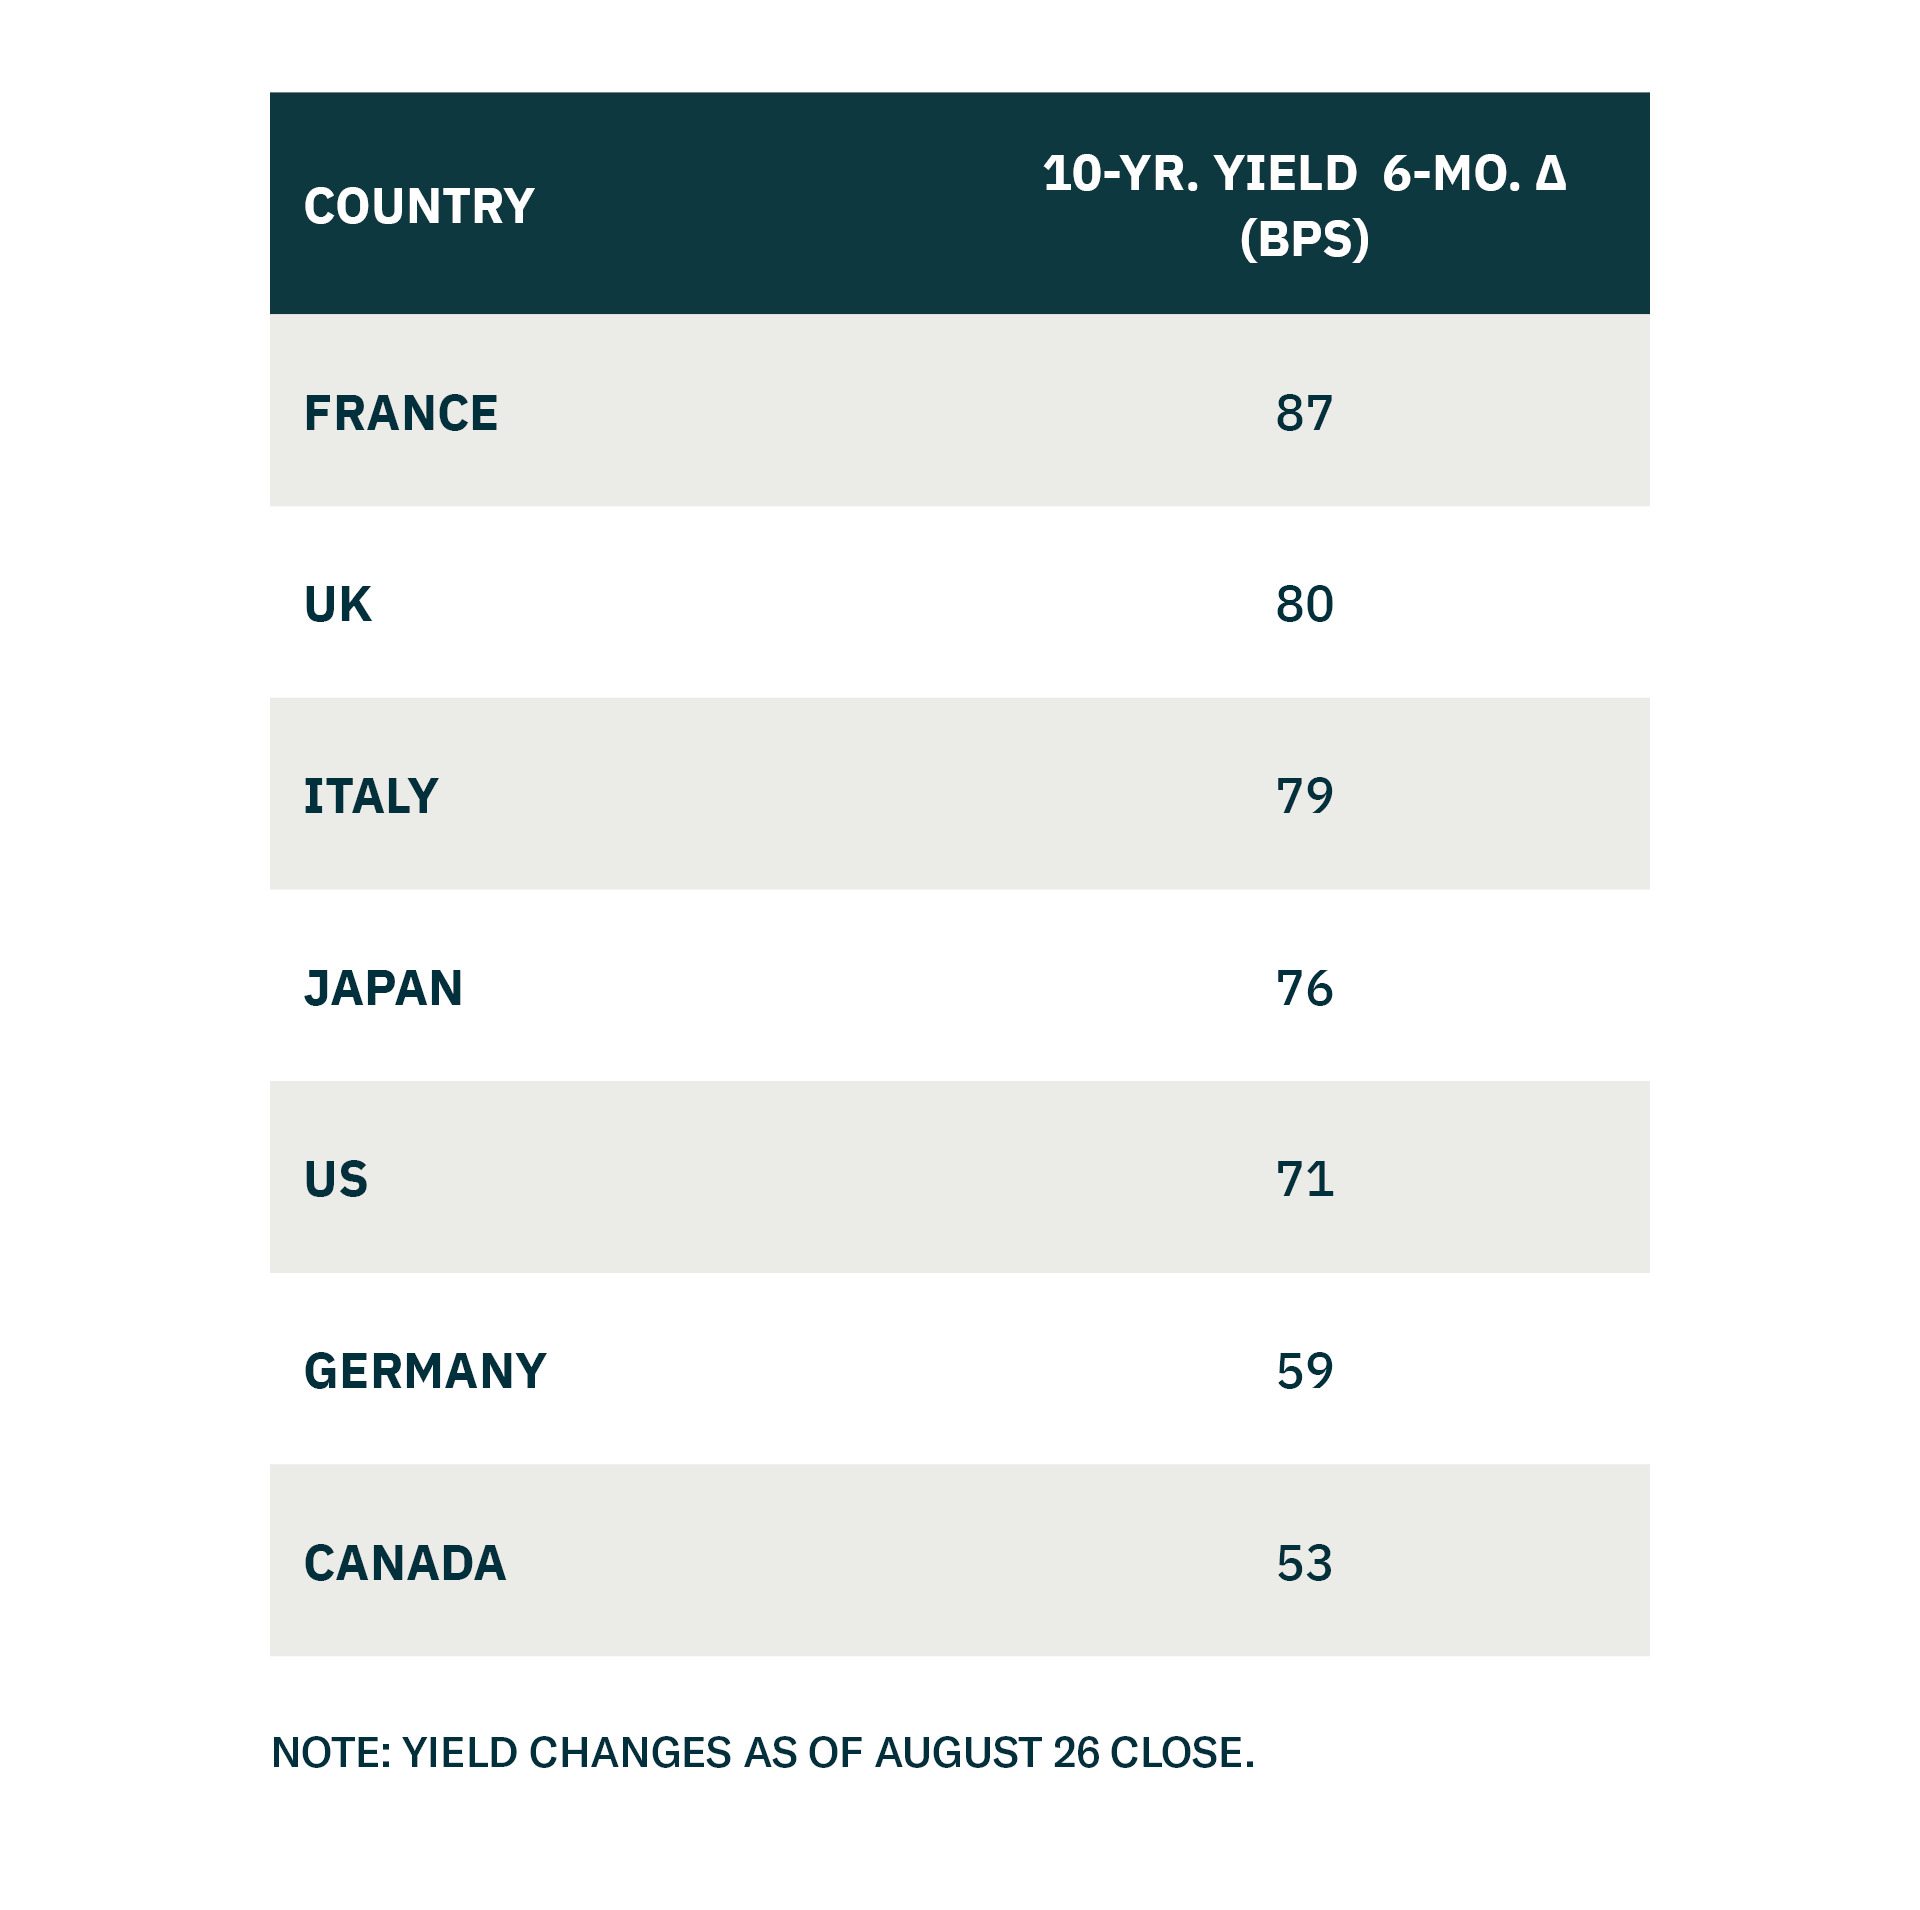
Figure 4 – Yields are higher all over
The next question is whether the cause of rising long-term yields is limited to the US at all. Over the past six months, benchmark 10-year yields have risen materially across many developed economies – see Figure 4. That is a common shock, and it dates from the outbreak of the conflict with Iran at the end of February. The European Central Bank and the Bank of Japan both raised policy rates by 25 basis points in June, and swap curves now price two or three further hikes across the major central banks over the coming twelve months.
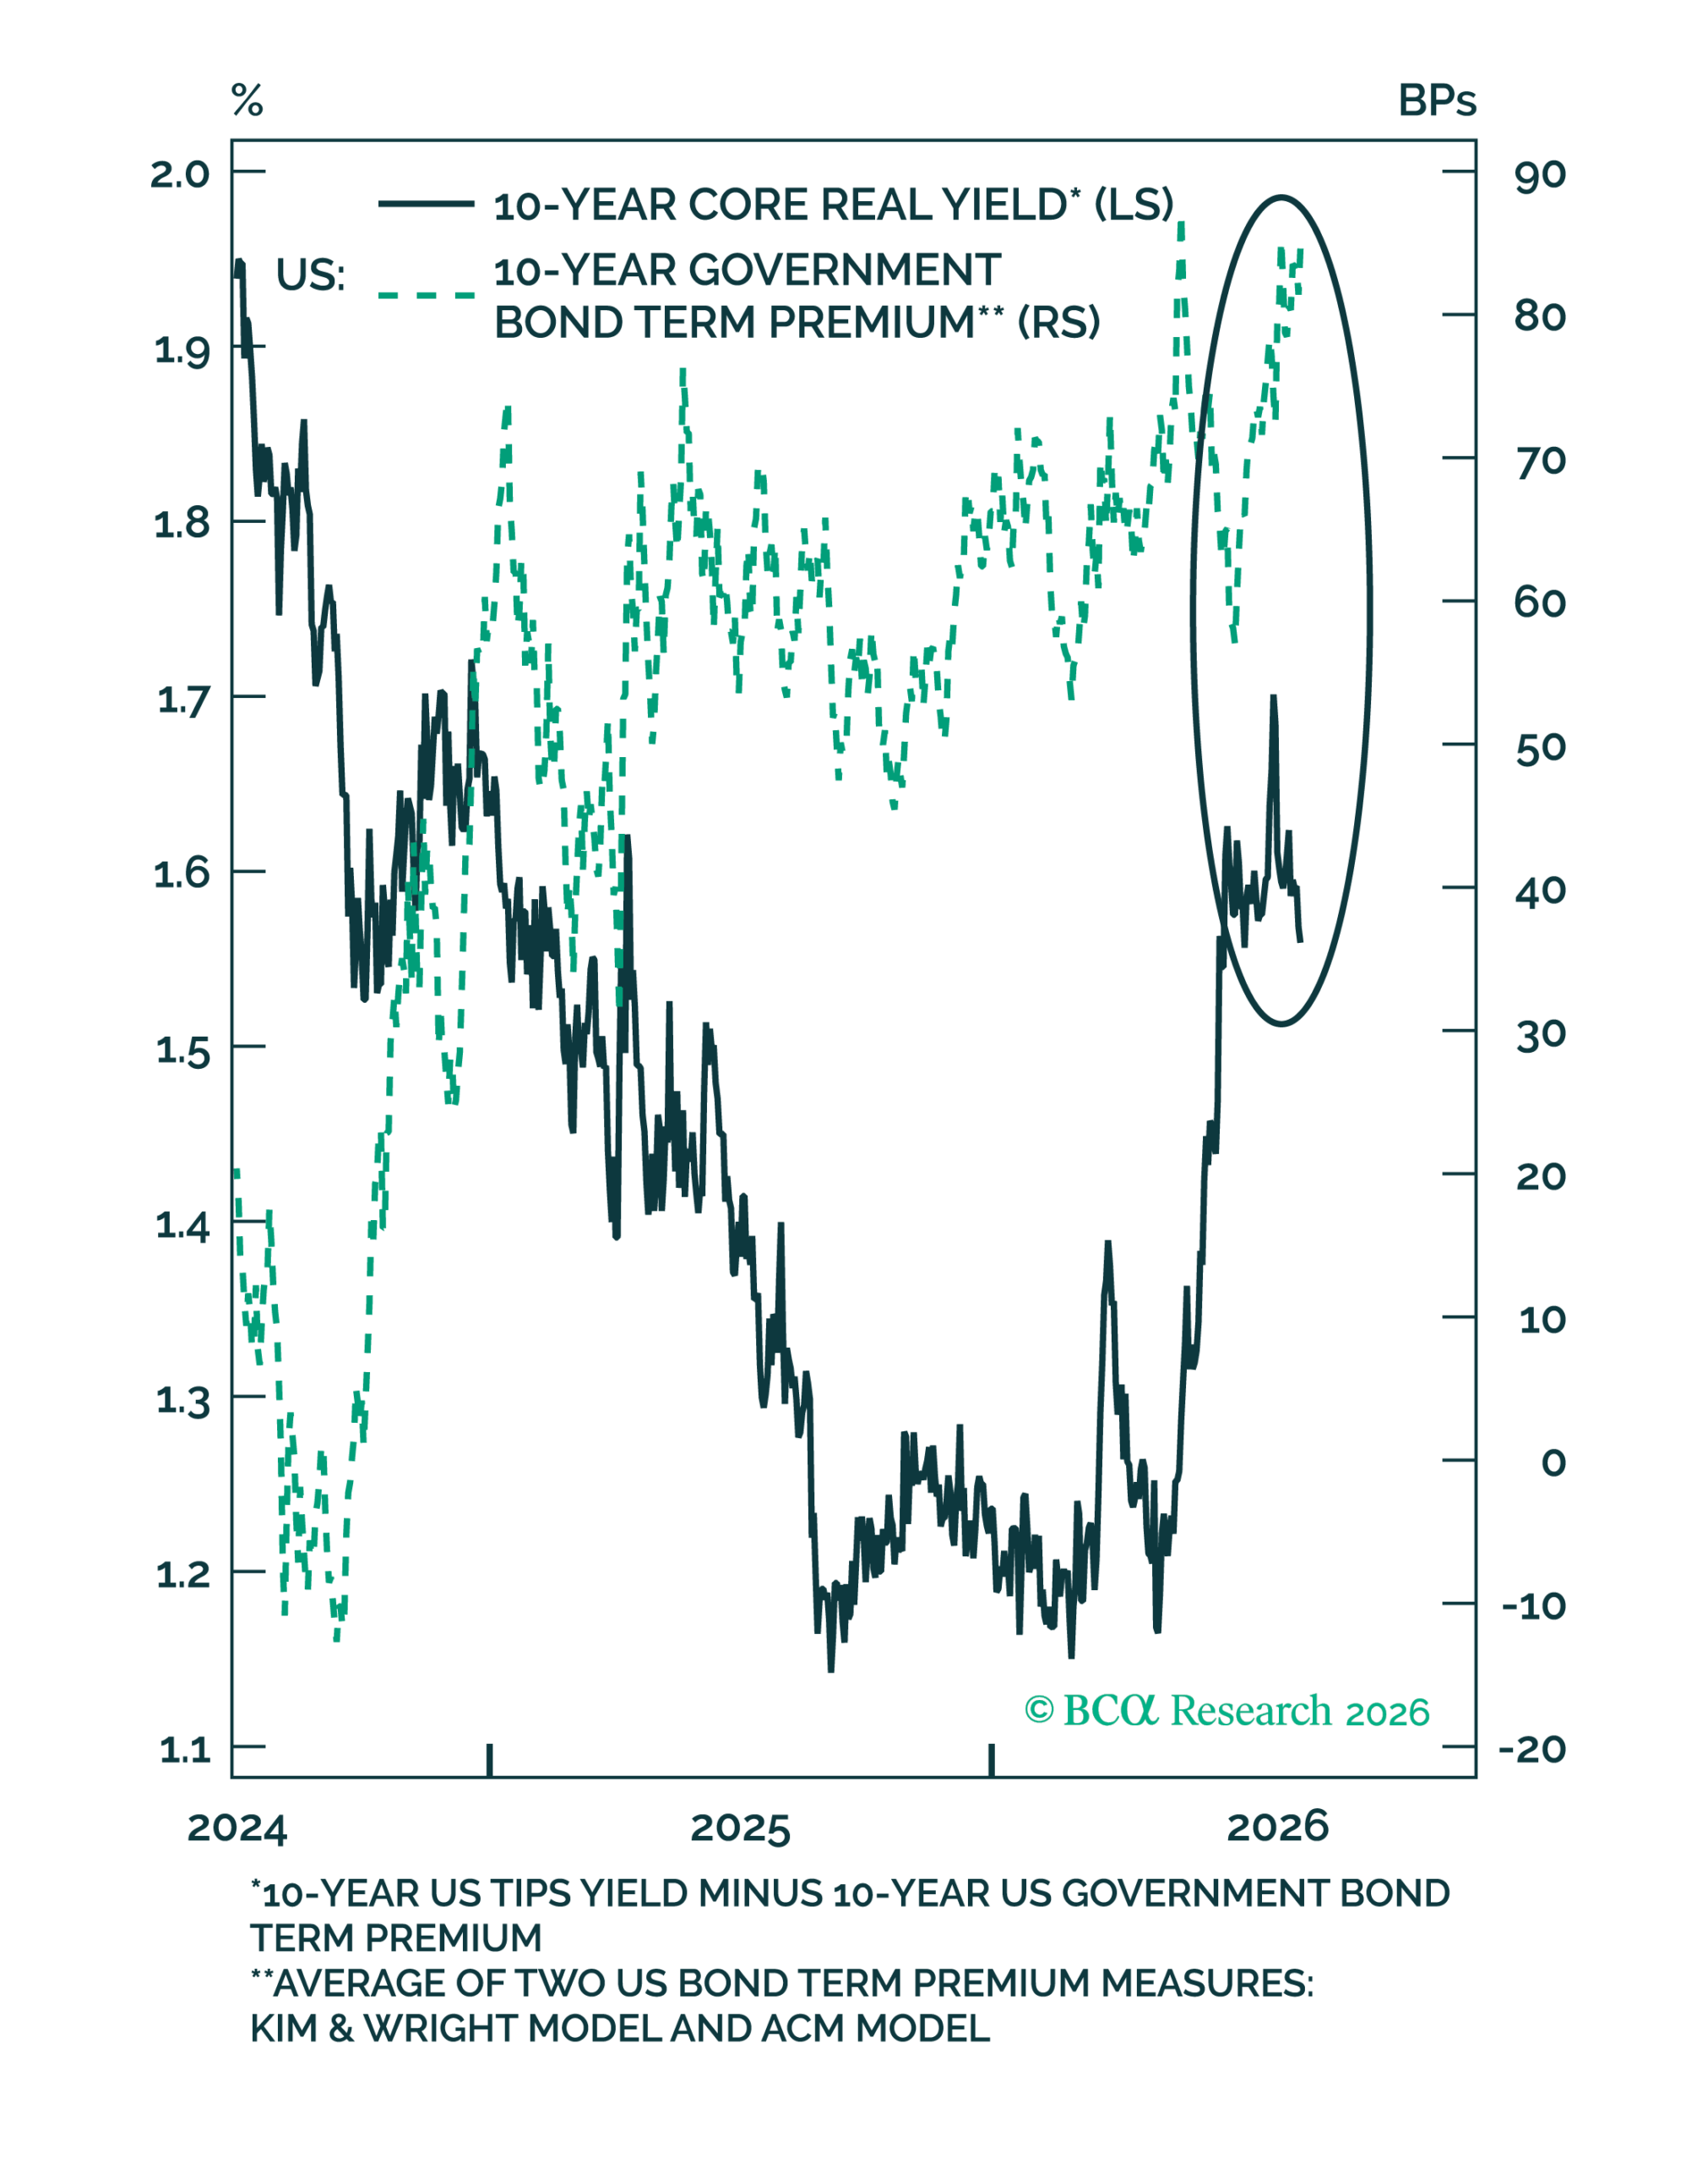
Figure 5 – The term premium, not growth, has lately been driving yields up
Reverting back to US-specific yields again, it helps to split the inflation-protected yield into its two parts. One part is the core real yield, which is the return investors expect on capital in real terms, and which rises when growth prospects improve. The other is the term premium, the extra compensation demanded simply for holding a long-dated instrument, which widens when the fiscal outlook deteriorates or when the future path of inflation becomes harder to predict. The recent move has been almost entirely the second of these, with the core real yield having stalled and beginning to roll over recently – see Figure 5. This distinction has consequences well beyond the bond market. A yield rising because expected real returns are improving pulls foreign capital in and supports the currency. A yield rising because investors want more insurance against fiscal and inflation uncertainty pushes capital away and weakens it. This could explain why the dollar has softened this year even while headline real yields sit at elevated levels.

Figure 6 – The Hormuz impasse may be easing
As mentioned, the inflation uncertainty embedded in the term premium traces back to the February energy spike. Near-month Brent has ticked back up into the $85 to $95 range, and Iran’s grip on the Strait of Hormuz remains strong. There is, however, a tentative sign of movement: Private US crude inventories have been climbing against their seasonal range, which suggests more oil is leaving the Gulf than the official vessel tracking data captures – see Figure 6. An increase in maritime traffic through the Strait would provide a far clearer tailwind for global rates than any strategies communicated by the US Treasury.
On a collision course
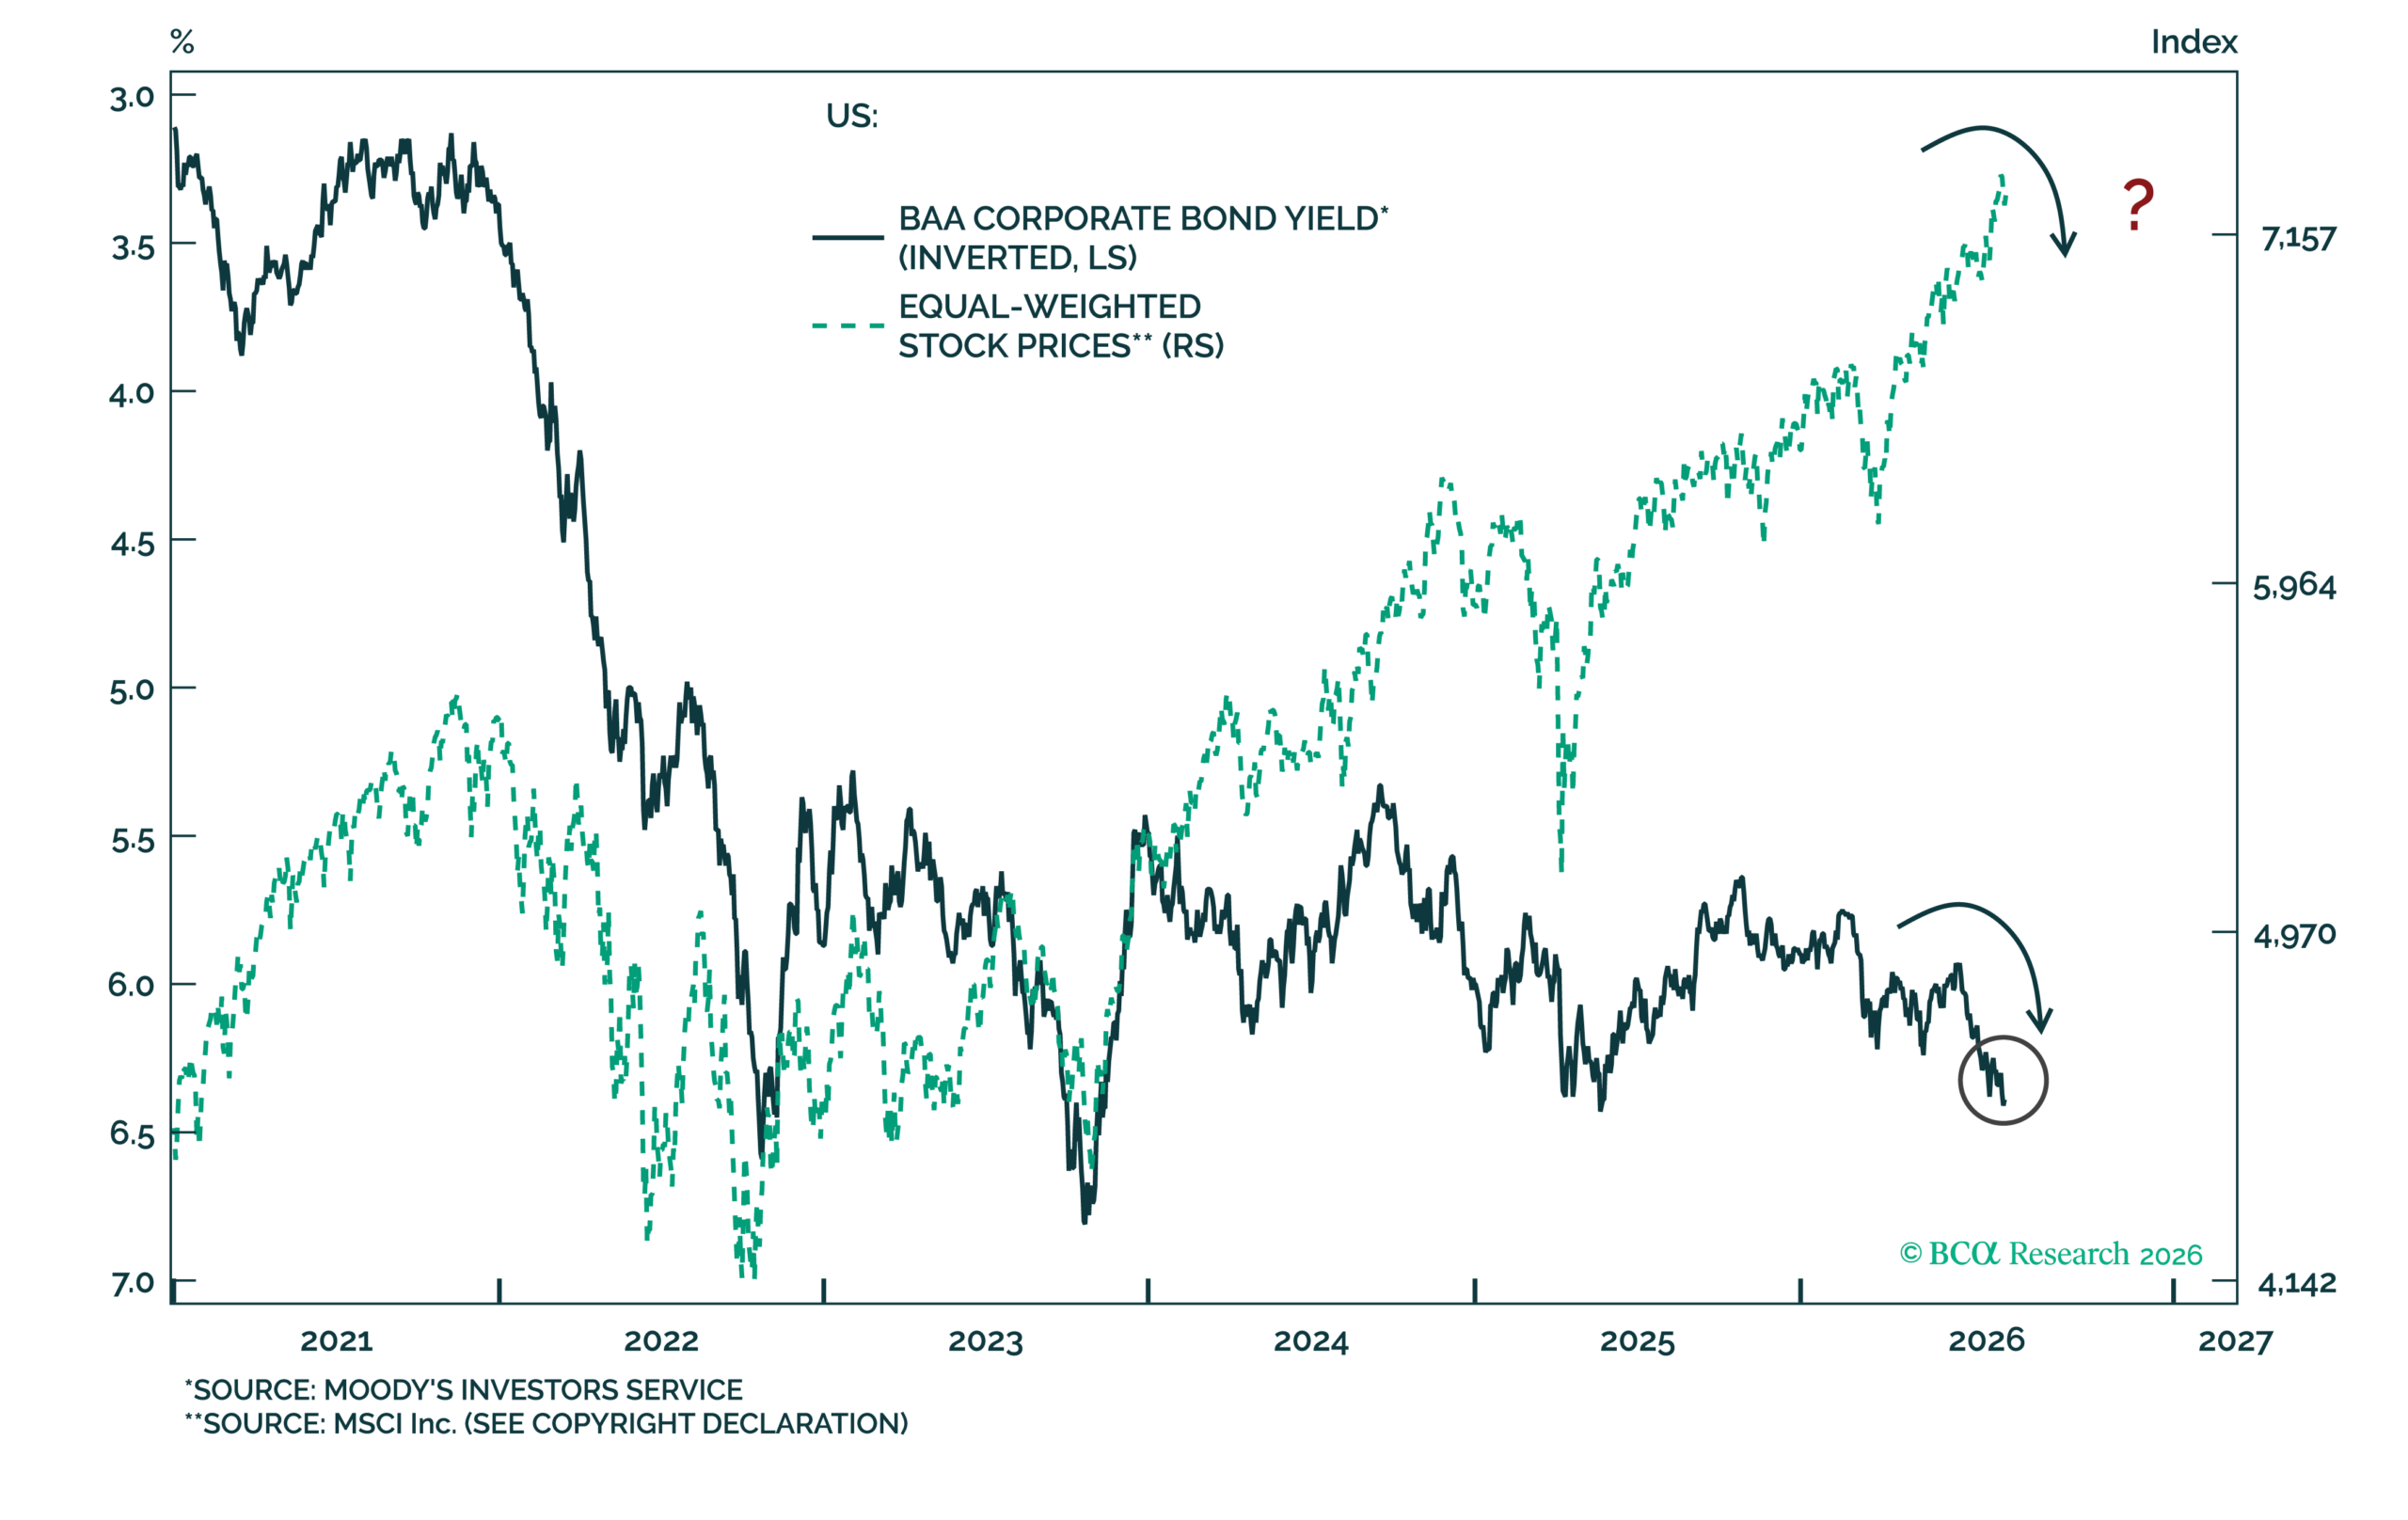
Figure 7 – The credit market and equity divergence is not sustainable
The reason that the US yield story matters for equity investors is that share prices and bond yields have not historically been able to rise together for long. It bears mentioning, the rate that matters most for share prices is not the Treasury yield but the corporate bond yield. That relationship has decoupled, with corporate yields rising while equal-weighted share prices have kept climbing – see Figure 7. Over the past forty years, bond bear markets have rarely ended in a calm mean reversion. Instead, a durable rally in Treasuries has tended to require a fall in the S&P 500 first.
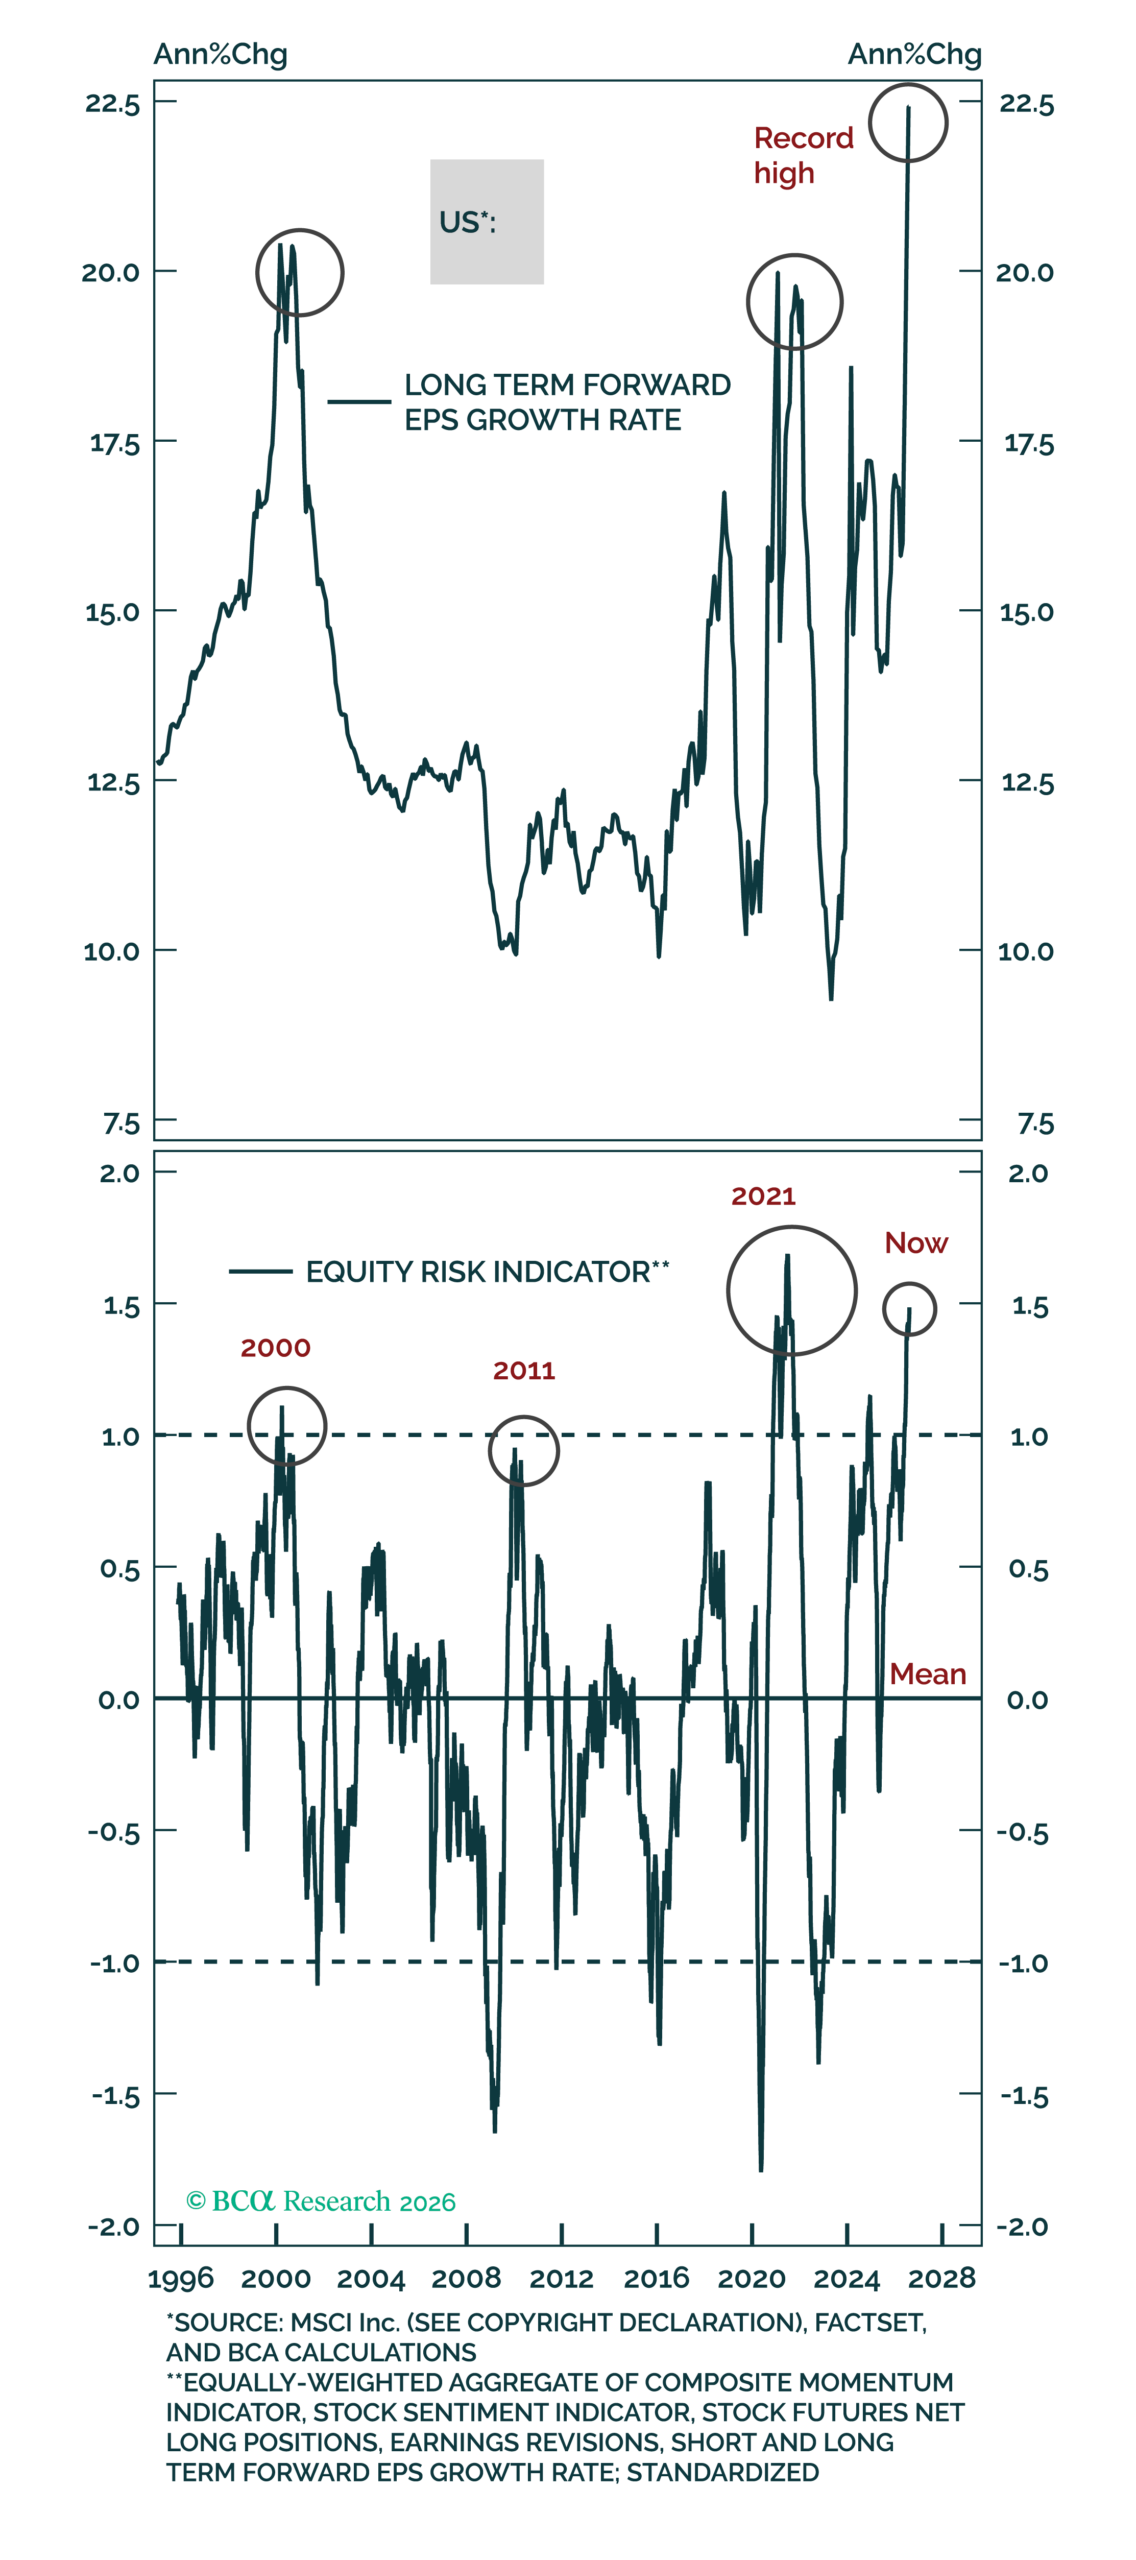
Figure 8 – US equity sentiment is overly optimistic
The current equity valuations offer little cushion against this coming tide. Analysts’ long-term forward EPS growth expectations for US equities are the highest on record – see Figure 8. An interesting comparison is 1987: A new Fed chair arrived (Alan Greenspan), the central bank was hiking into rising inflation, bond yields were climbing and the dollar was falling. Corporate profits were expanding at a healthy margin throughout, and the S&P 500 rallied alongside all of it before dropping 30% within mere days that October. In retrospect the crash was not caused by deteriorating fundamentals at all, but rather a sudden shift in sentiment. While an exact parallel would be improbable, 1987’s lesson remains that we cannot expect share prices to keep rising indefinitely while bond yields drift ever higher, even despite the strong earnings.
On the other hand, it is difficult to warrant for this shift to happen at a moment’s notice. On Nvidia’s recent earnings, the company guided FY2028 revenue growth to 70% against an expected 45%, sending the shares up as much as 10%. For a company that has kept guidance at a strict quarterly level, the switch to a full fiscal year of guidance is by all accounts a bullish signal for continued momentum. Furthermore, revised second quarter data showed real final sales to private domestic purchasers growing at a 4.2% annualised rate. Demand is still outstripping production capacity.
Investment takeaway
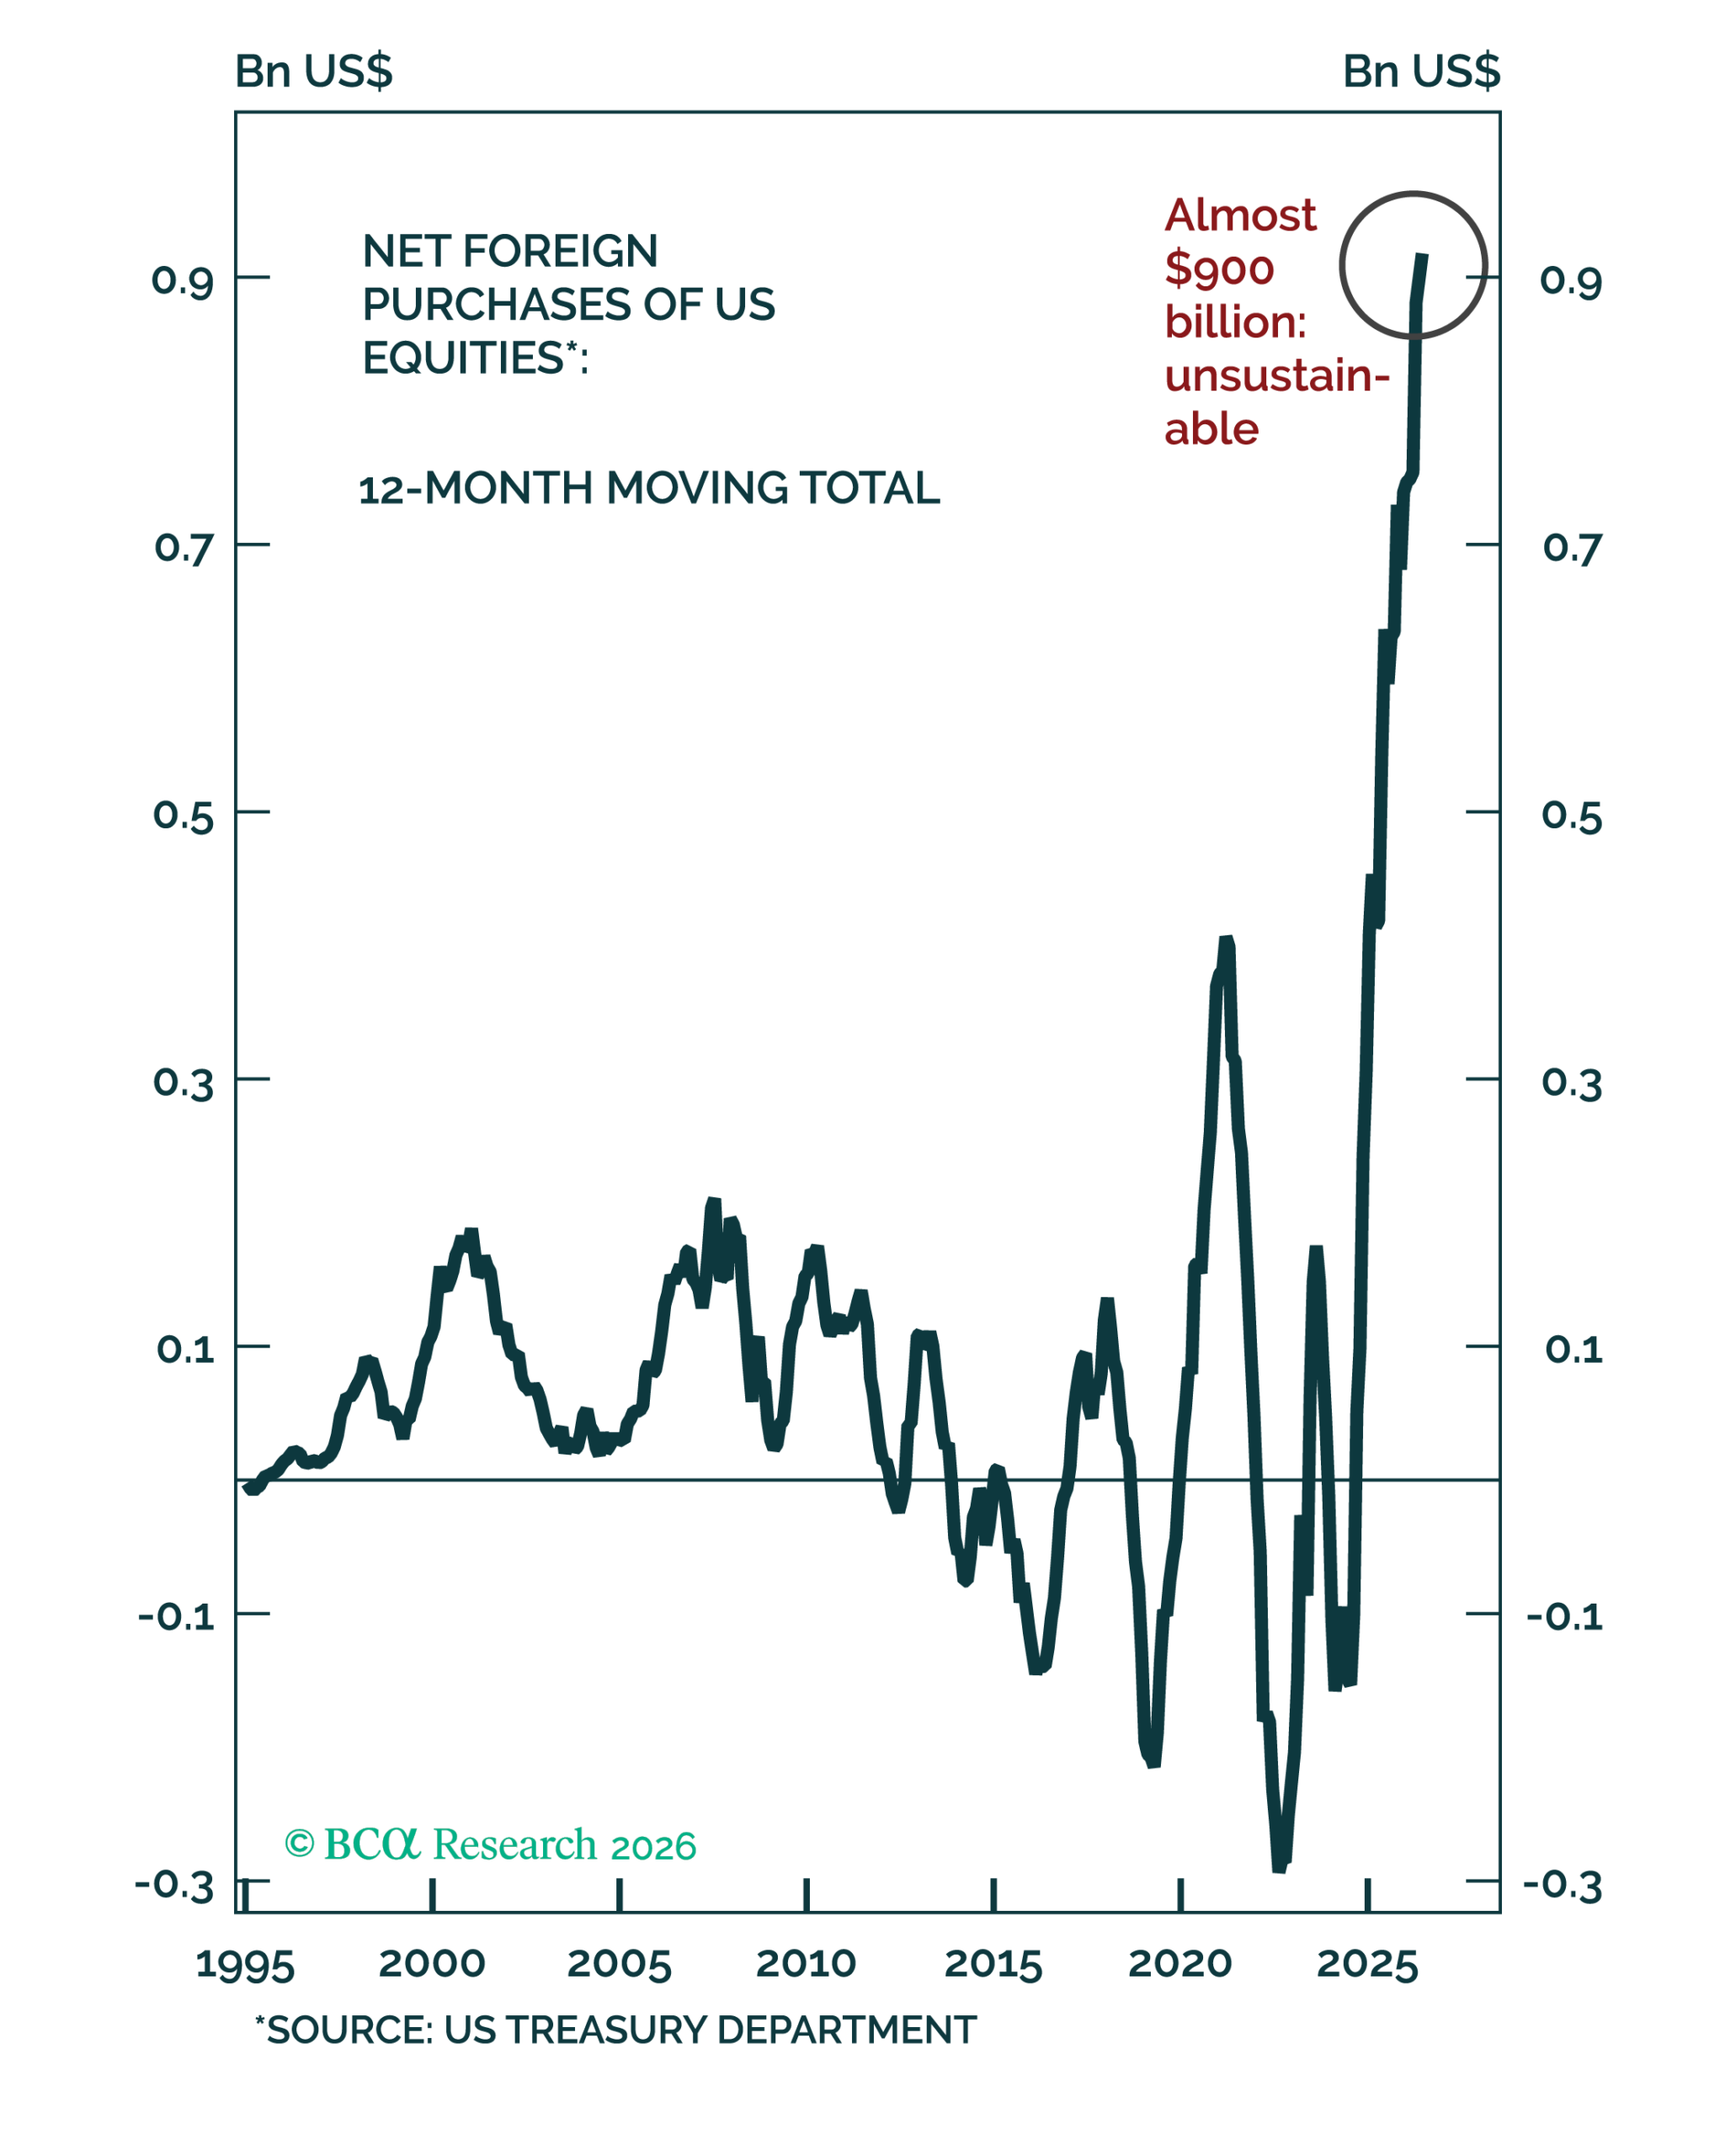
Figure 9 – The AI story is propping up the dollar
Digging deeper, what US equity strength conceals is how narrow the channel supporting it is becoming. Net foreign purchases of US equities have run at close to $900 billion on a twelve-month basis, and that flow is what has been financing a current account deficit of roughly $1 trillion – see Figure 9.
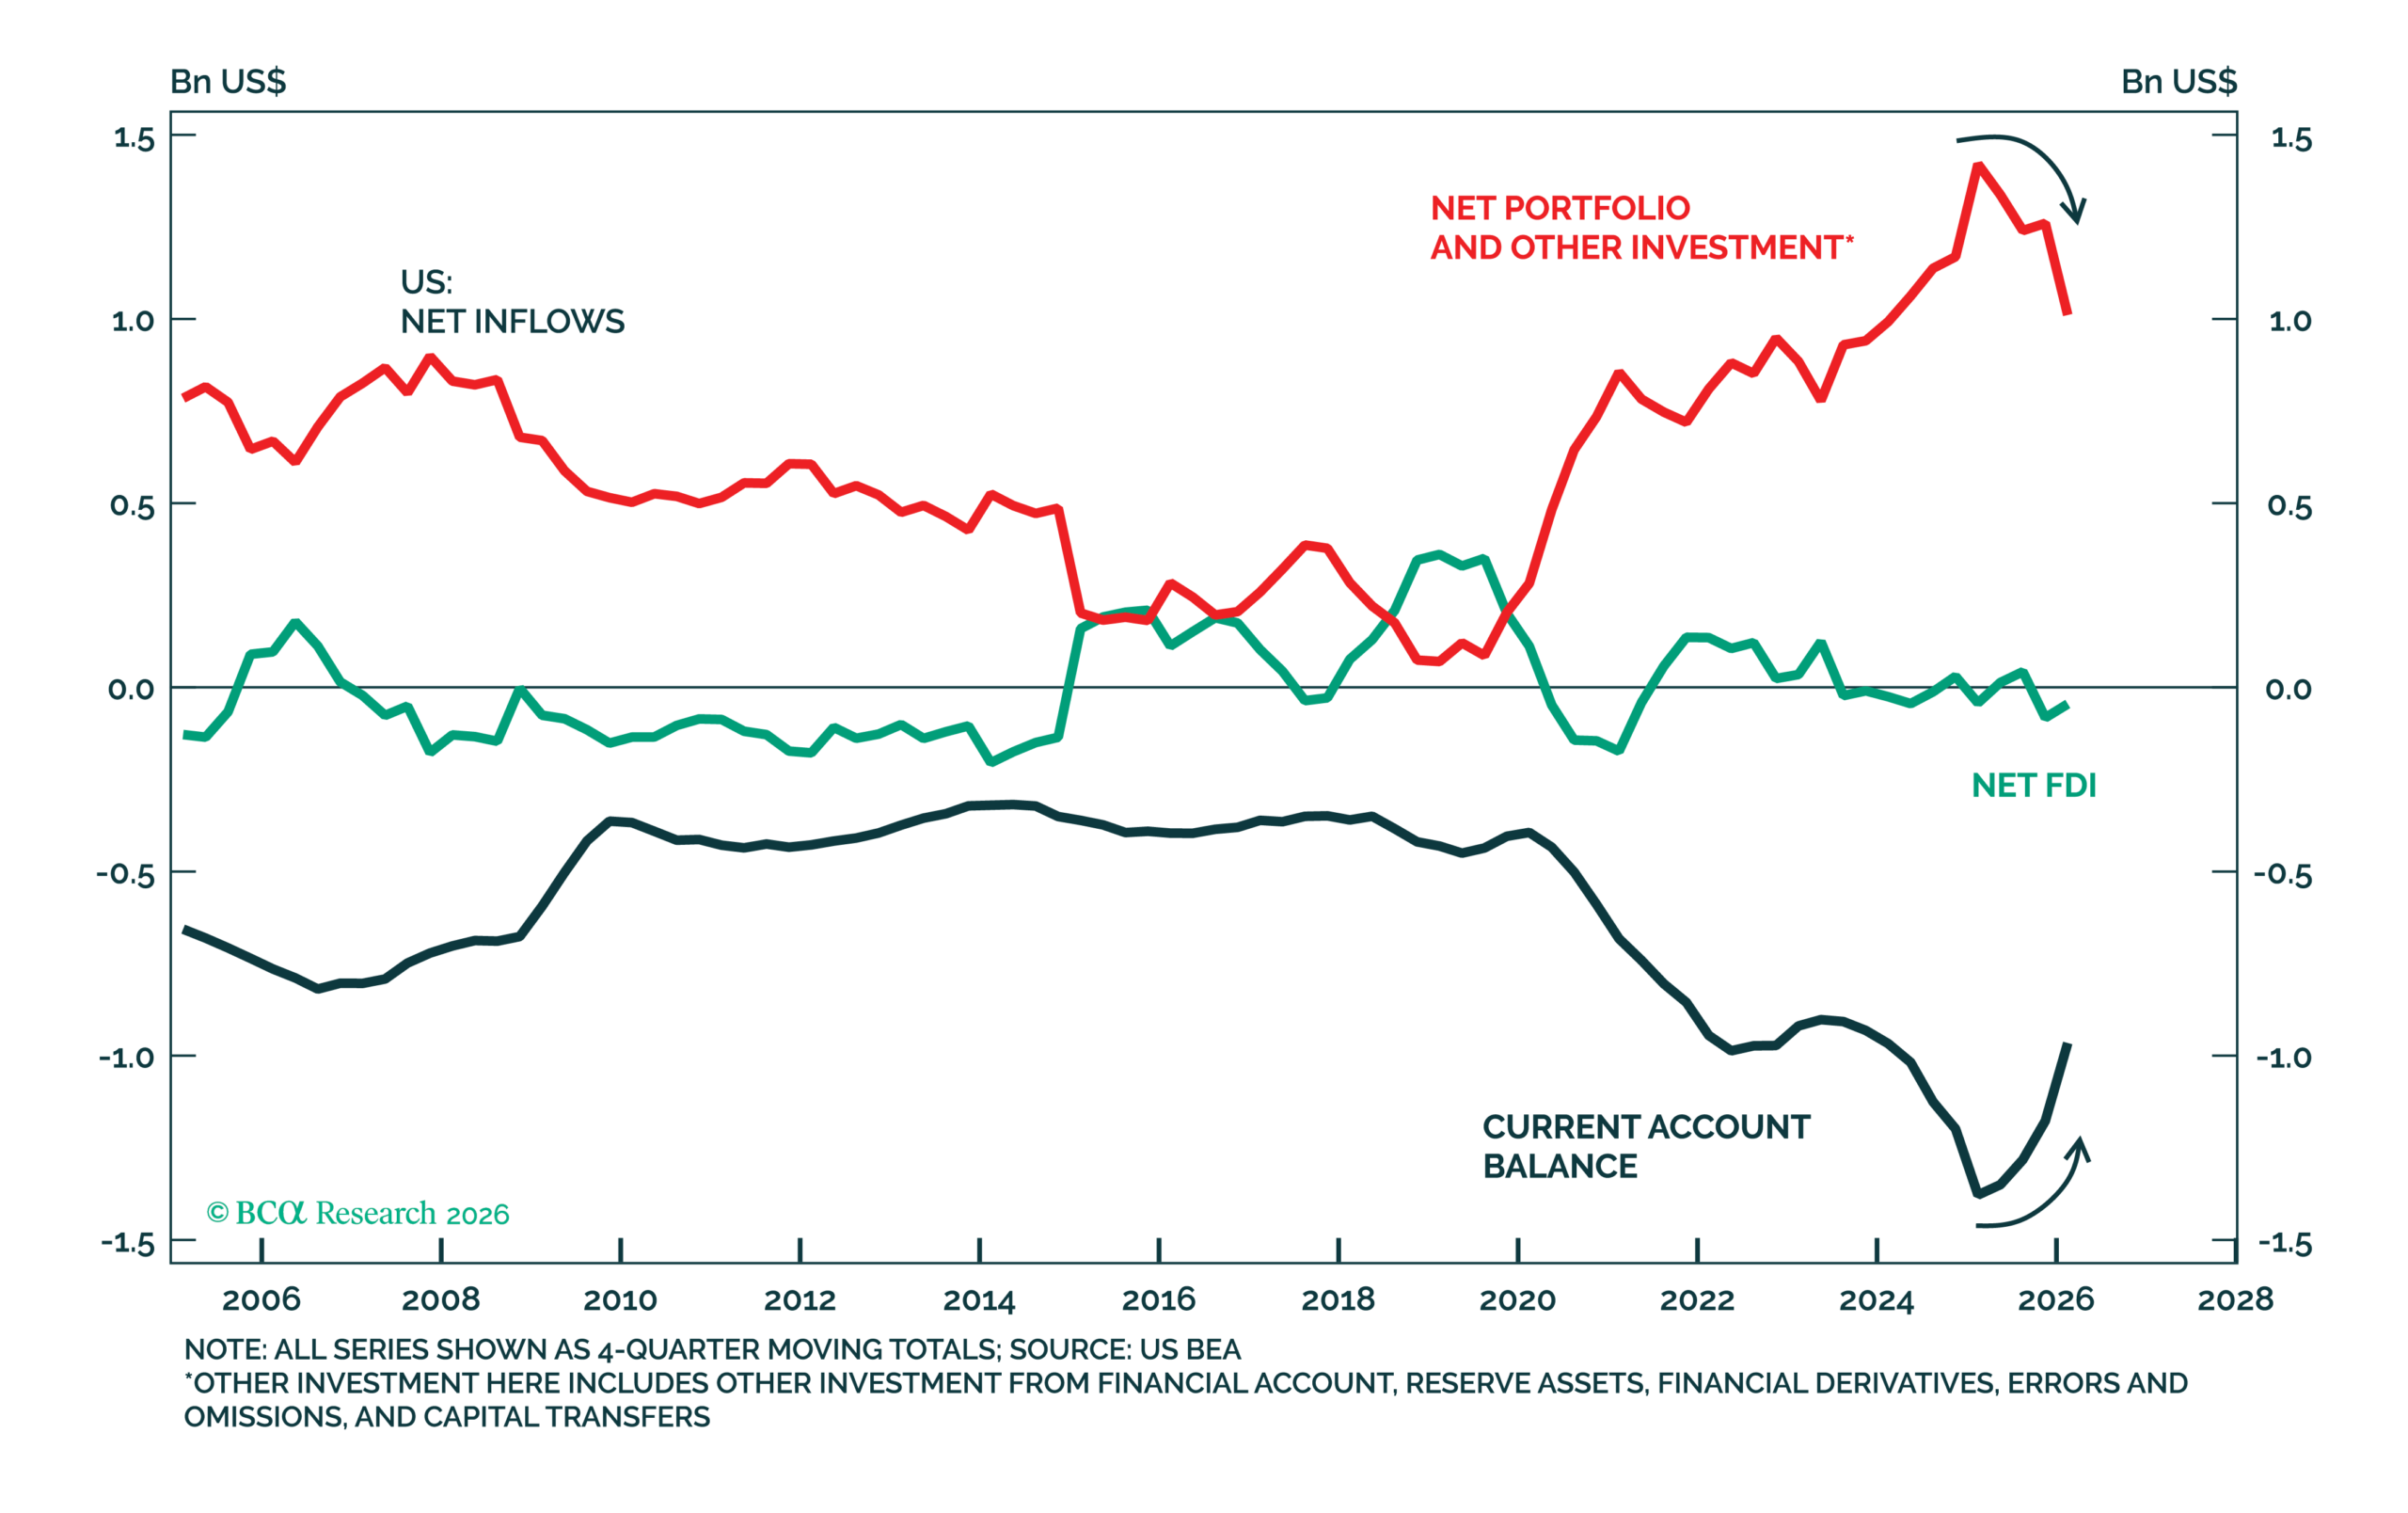
Figure 10 – Foreign capital inflows driving US dollar strength are reversing
The same theme that has lifted the equity market has therefore also been holding up the currency, and those inflows have now begun to roll over – see Figure 10. American assets have historically offered a hedge within themselves, in that a weaker equity market brought a firmer dollar as capital came home and sought safety. If the equity market and the currency are both being underwritten by the same foreign flow, that offset stops working, and the two begin to move together rather than against each other.
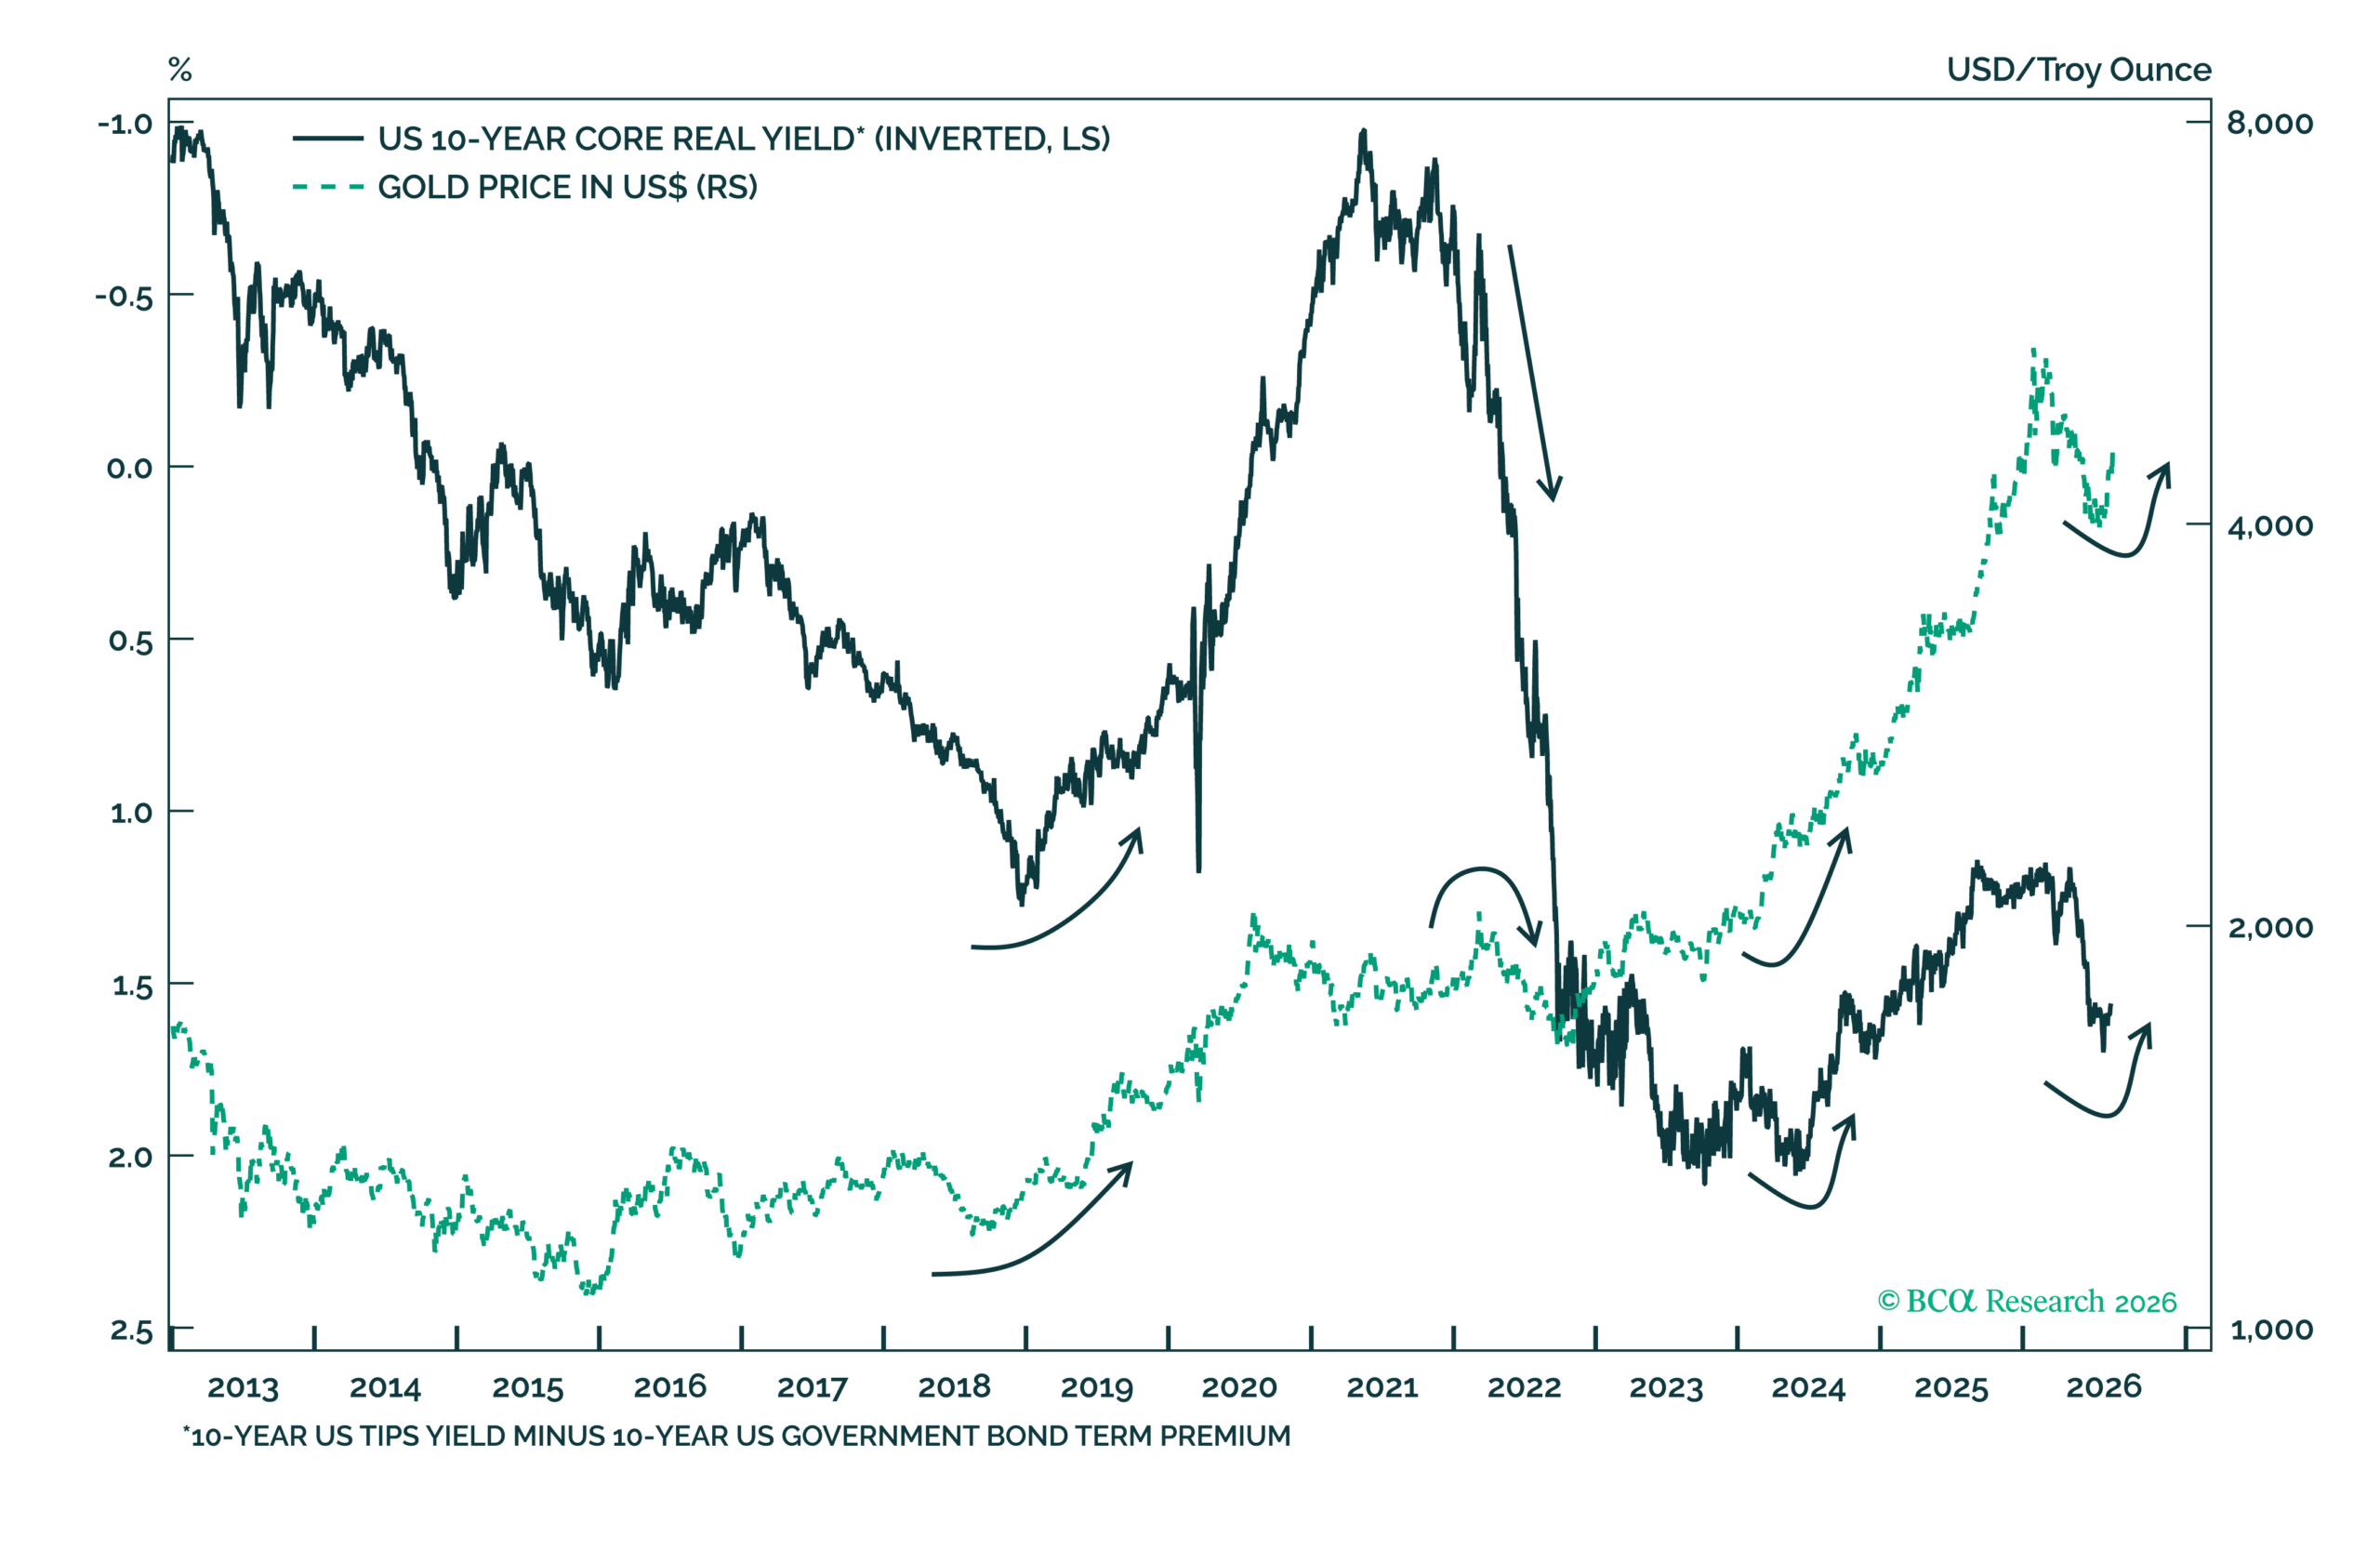
Figure 11 – Core real yields explain fluctuations in gold prices
It is worth noting that gold sits on the other side of this mechanism, since its price is driven mainly by the core real yield that has now rolled over, while being positively correlated with the term premium that has widened – see Figure 11. For an investor holding US equities from abroad, the earnings outlook is only half the risk exposure worth considering. The rest now depends on the dollar, which has historically cushioned foreign holders during a US selloff by rising as capital moved into Treasuries. That cushion is not guaranteed to be there next time.
If you are interested in finding out more about how cognisance of the macroeconomic backdrop impacts our investment decision making process, connect with Integrity Asset Management and let us help you navigate your investing journey.
For more information on this synopsis or to discuss solutions provided by Integrity Asset Management, please contact us at:
Tel: (021) 671 2112
Cell: 072 513 2684 / 084 601 1025
E-mail: nic@integrityam.co.za / herman@integrityam.co.za
Source: Bloomberg, 31 August 2026